My Authors
Read all threads
Va un nuevo hilo 🧵con muchas gráficas actualizando el análisis del #Covid19 para el #BIADN40 con datos a las 19 hrs. del 25/03 (CDMX).

Comienzo con gráficas de México.
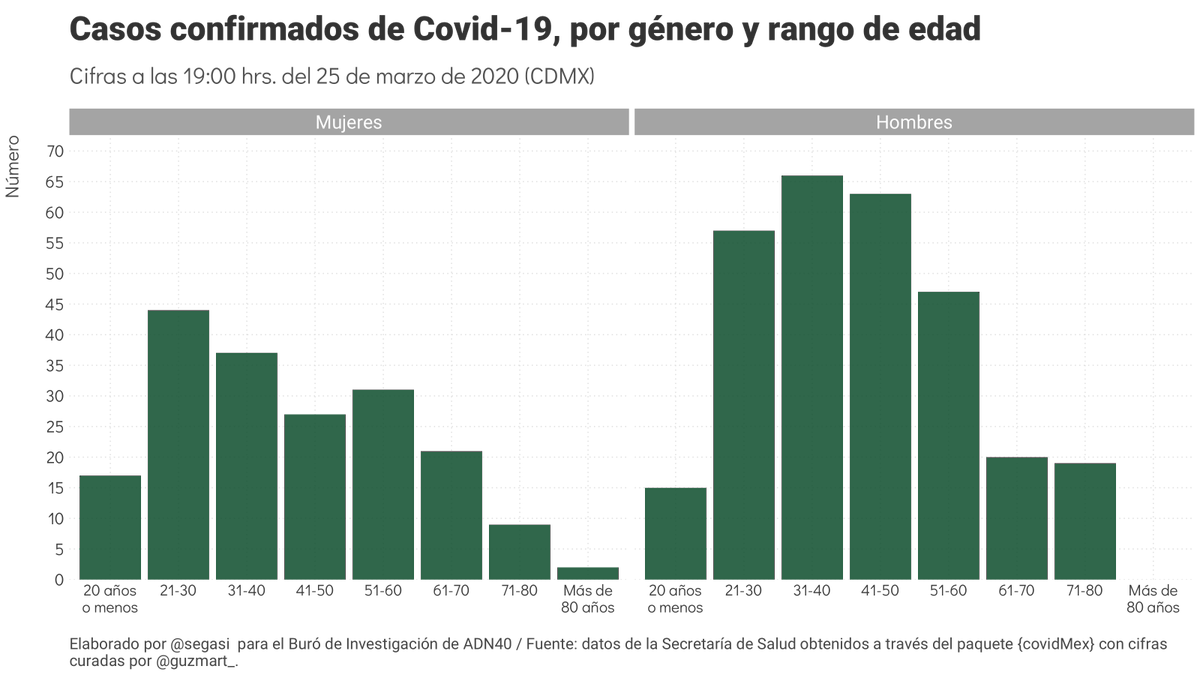
Hoy se registró el mayor incremento diario hasta la fecha: 70 nuevos casos
Ya hay casos en las 32 entidades. Tlaxcala fue la última
Comienzas las gráficas con datos de países de América con más de 1 millón de habitantes
Misma escala en el eje vertical...
Escala libre en el eje vertical...
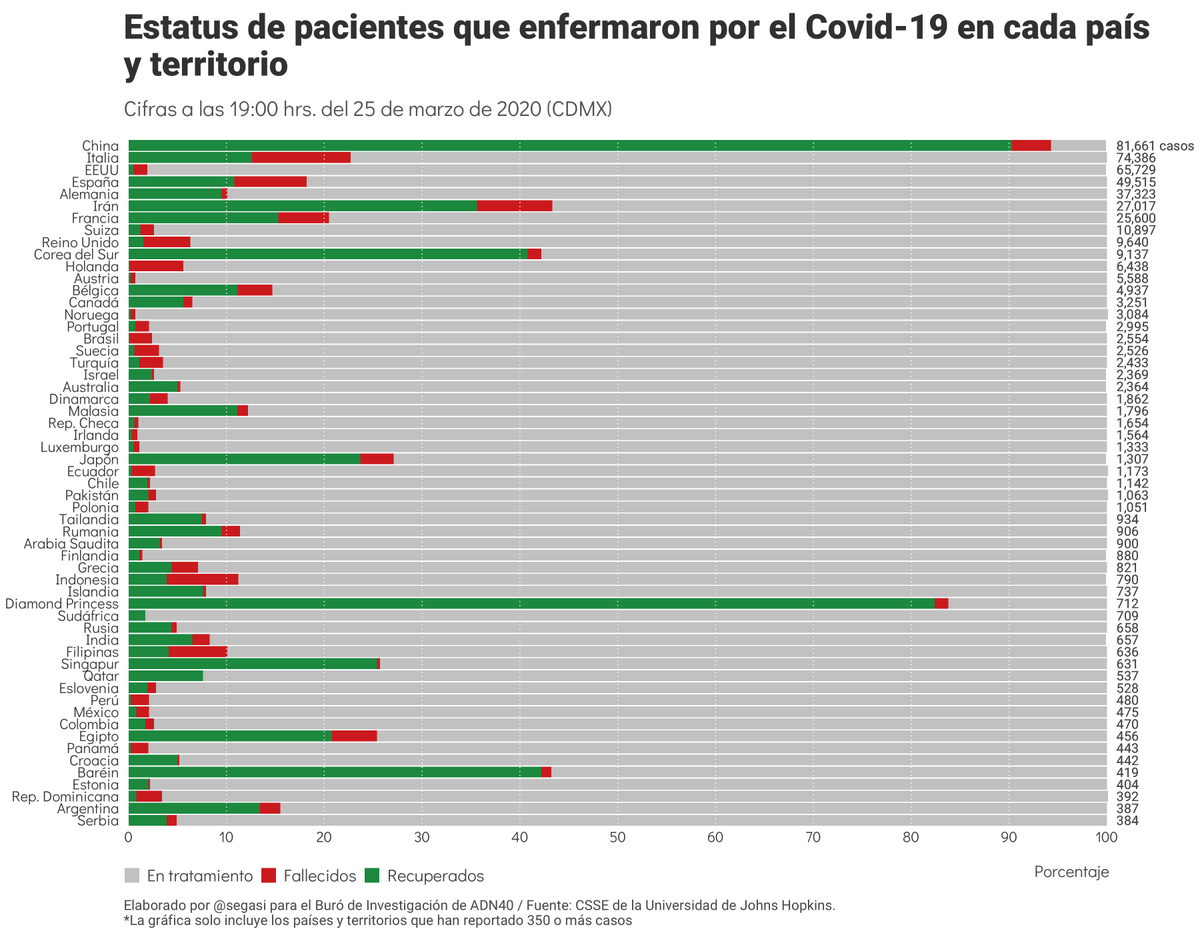
Gráficas con datos mundiales
Hoy se registró el mayor número de muertes en diarias hasta la fecha
Fuentes:

@JHUSystems: gisanddata.maps.arcgis.com/apps/opsdashbo…

@SSalud_mx: vía {covidMex} de @pablorm296, con cifras curadas por @guzmart_.

Todas las gráficas hechas con #rstats, #dplyr y #ggplot2.
Missing some Tweet in this thread? You can try to force a refresh.

Enjoying this thread?

Keep Current with Sebastián Garrido

Profile picture

Stay in touch and get notified when new unrolls are available from this author!

Read all threads

This Thread may be Removed Anytime!

Twitter may remove this content at anytime, convert it as a PDF, save and print for later use!

Try unrolling a thread yourself!

how to unroll video

1) Follow Thread Reader App on Twitter so you can easily mention us!

2) Go to a Twitter thread (series of Tweets by the same owner) and mention us with a keyword "unroll" @threadreaderapp unroll

You can practice here first or read more on our help page!

Follow Us on Twitter!

Did Thread Reader help you today?

Support us! We are indie developers!


This site is made by just three indie developers on a laptop doing marketing, support and development! Read more about the story.

Become a Premium Member ($3.00/month or $30.00/year) and get exclusive features!

Become Premium

Too expensive? Make a small donation by buying us coffee ($5) or help with server cost ($10)

Donate via Paypal Become our Patreon

Thank you for your support!