7 Mega Cities in India – Ahmedabad, Bengaluru, Chennai, Delhi, Hyderabad, Kolkata, and Mumbai have 42% of COVID cases and 53% of COVID deaths in India.
Death Per Million population (DPM) is 114 ; #health infrastructure in these megacities is over stretched. 1 of N
Death Per Million population (DPM) is 114 ; #health infrastructure in these megacities is over stretched. 1 of N


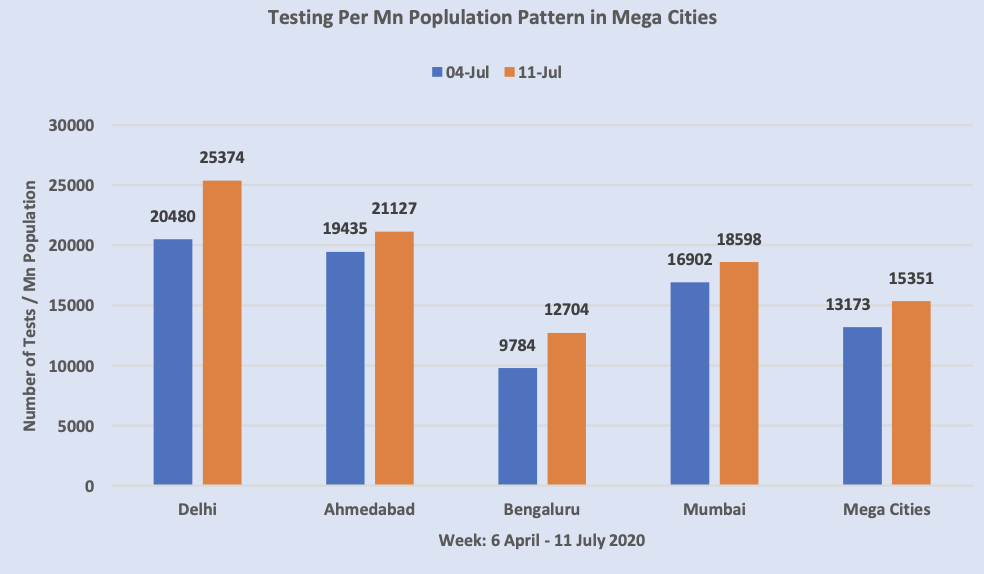
Week-on-Week testing in mega cities has increased by 16.5%. #COVID19 positivity / million in mega cities has increased from 2841 to 3324. Recovery / million population from 1745 to 2218 validates that most of the COVID cases in mega cities are in “Mild-Very Mild Category” 2 of N


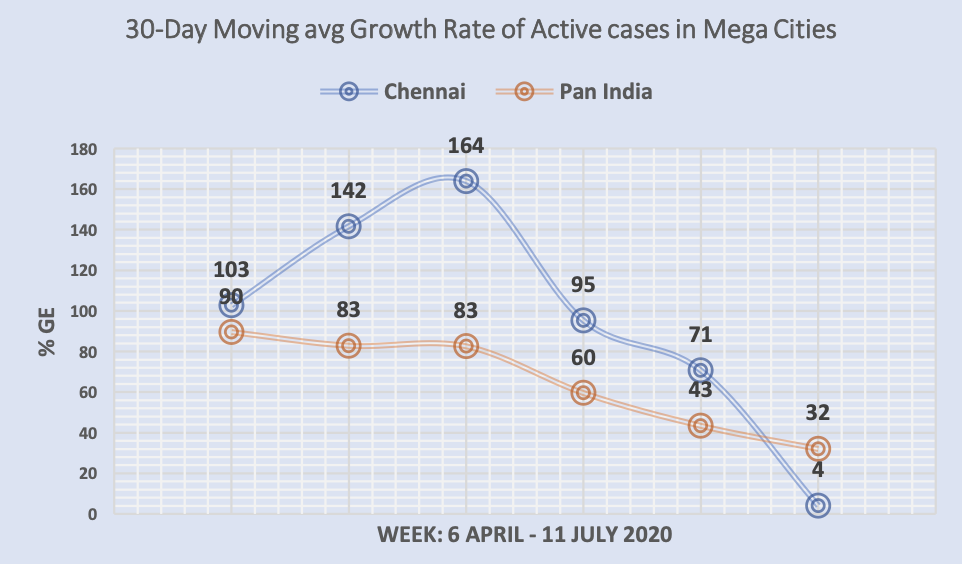
The 30-day moving average growth rate of active cases dropping from 60% to 32% in megacities. The velocity of spread might be tapering down in some megacities. Caution: week-on-week data on cases & deaths can vary; growth should be negative, sooner is better.
3 of N
3 of N


Regions with Low TPR, High MR
-Severely affected and the local administration is finding challenge to manage the situation
- Need to completely change the testing strategy, tools, and techniques.
- Demand for highly skilled talent for clinical management
5 of N
-Severely affected and the local administration is finding challenge to manage the situation
- Need to completely change the testing strategy, tools, and techniques.
- Demand for highly skilled talent for clinical management
5 of N


#Ahmedabad update: 30-day moving average growth of fatality in Ahmedabad has almost halved.
-Positivity per million population down below the average positivity / mn of mega cities
-Recovery / mn population continues above average of mega cities.
•CFR is high at 6.6% 6ofN
-Positivity per million population down below the average positivity / mn of mega cities
-Recovery / mn population continues above average of mega cities.
•CFR is high at 6.6% 6ofN


#Bengaluru update: 1 week Lockdown from 14th July. It will be great if the city can use this time to achieve
• Week-on-Week Increase in number of tests to atleast 200K
• Reduction in TP from 11% to 6.4%
• Reduction in 30-day moving average GR of active cases to <500% 7ofN
• Week-on-Week Increase in number of tests to atleast 200K
• Reduction in TP from 11% to 6.4%
• Reduction in 30-day moving average GR of active cases to <500% 7ofN


#Chennai update: Testing data is not available in the public domain
• Recovery / mn population 5191 more than twice of average of mega cities at 2218.
• Fatality 111 / Mn Population, Chennai is 2nd highest amongst Mega cities.
• Case Fatality Rate of Chennai is at 1.4%,
8/N
• Recovery / mn population 5191 more than twice of average of mega cities at 2218.
• Fatality 111 / Mn Population, Chennai is 2nd highest amongst Mega cities.
• Case Fatality Rate of Chennai is at 1.4%,
8/N


#Delhi Weekly Update
• Negative growth (-15%) of 30 day moving average rate of active cases: higher recovery
• Drop in 30-day moving average growth rate of deaths inspite of increase in positivity per million population reflects improved efficacy of medical intervention
9 of N
• Negative growth (-15%) of 30 day moving average rate of active cases: higher recovery
• Drop in 30-day moving average growth rate of deaths inspite of increase in positivity per million population reflects improved efficacy of medical intervention
9 of N


Kolkata: Weekly Update
•Testing data is not available in the public domain, the Test Positivity Rate and Test Positivity / Mn Population.
• 30 Day Moving average growth rate of active cases from 16% to 61% reflects the sharp.
• 5.3% Case Fatality Rate along with 8.3%
10 of N
•Testing data is not available in the public domain, the Test Positivity Rate and Test Positivity / Mn Population.
• 30 Day Moving average growth rate of active cases from 16% to 61% reflects the sharp.
• 5.3% Case Fatality Rate along with 8.3%
10 of N


Mumbai: Weekly Update
•Trend indicates encouraging improvement in all areas of measurement:
• Week-on-Week testing has increased by 10%, so as the positivity / mn. From 2619 / Million to 3108 & more importantly the active case has de-grown by 20%.
11 of N
•Trend indicates encouraging improvement in all areas of measurement:
• Week-on-Week testing has increased by 10%, so as the positivity / mn. From 2619 / Million to 3108 & more importantly the active case has de-grown by 20%.
11 of N


#Mumbai
• 30 Day moving average growth rate of deaths has fallen from 179% to 54%.
• Test Positivity Rate of 24% indicates continued spread of virus with high velocity.
• 7.6% of Closed Case Fatality Rate (CCFR) indicates need for improvement in medical intervention
12 of N
• 30 Day moving average growth rate of deaths has fallen from 179% to 54%.
• Test Positivity Rate of 24% indicates continued spread of virus with high velocity.
• 7.6% of Closed Case Fatality Rate (CCFR) indicates need for improvement in medical intervention
12 of N
It is time for each state to ramp up testing, facilitate early diagnosis and timely isolation.
Reducing deaths is the only goal.
N of N
Reducing deaths is the only goal.
N of N