Happy to see my new paper "Measuring the Regional Economic Costs of #Brexit: Evidence up to 2019" feature in @FinancialTimes. For interactive map ➡️ brexitcost.org, the FT article ➡️ ft.com/content/90e988…, the paper ➡️ bit.ly/2C9BOIg a short summary ⬇️ 1...
We use the synthetic control method previously used by @JohnSpringford @bornecon @MSchularick studying #Brexit-vote economic impact on the UK as a whole, just that we study regional economic output. The UK wide exercise is published in the @EJ_RES bit.ly/3j2zt2V 2...
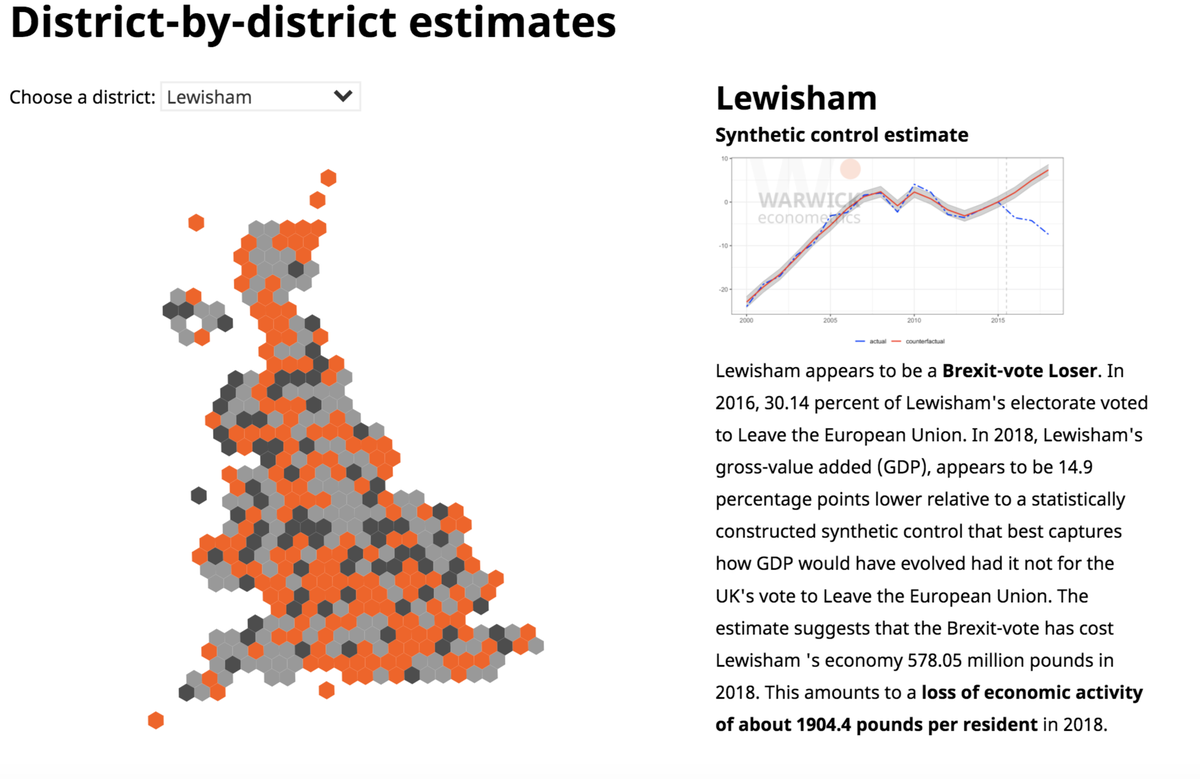
We apply (a lot of variations) on regional quarterly GDP as well as annual district-level Gross-value added data for the UK. In total, for districts we construct a total of 100+ synthetic control estimates to assess concerns of overfitting - below plot is the case of Lewisham 3.. 

Each dark curve represents a different synthetic control estimate constructed using different varying-sized donor pool sets. The blue line is the actual, the red-line represents the ensemble estimate. The gap between the synthetic controls and the actual is quite obvious. 4..
Lewisham is estimated to have lost around 2k pounds per capita as of 2018 due to the Brexit-vote. We produce interactive visualisations on brexitcost.org district-by-district and region-by-region, check them out...5..
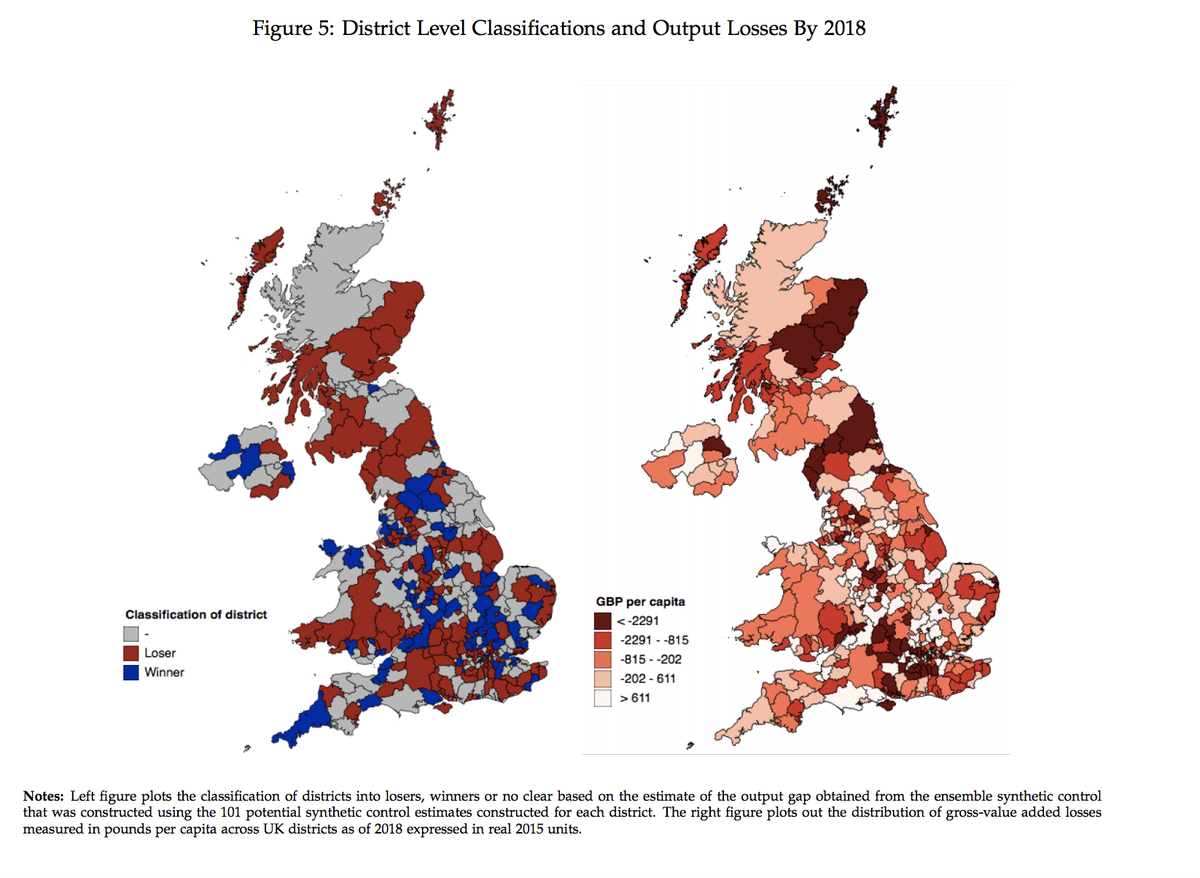
We classify district into #Brexit-vote winners and losers - guess what, the Losers outnumber the winners at least 2:1 with output being lower in at 250 out of 380 districts... 6...

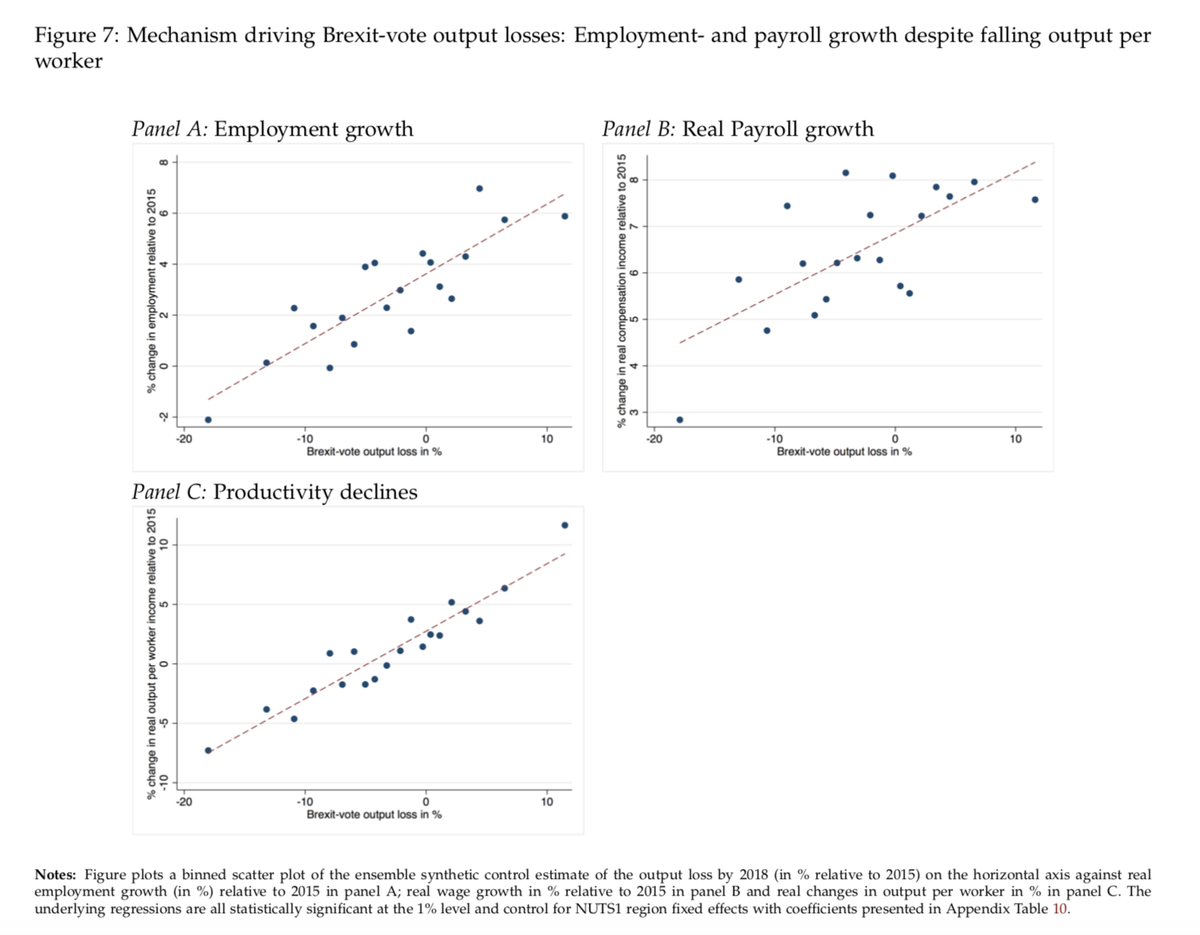
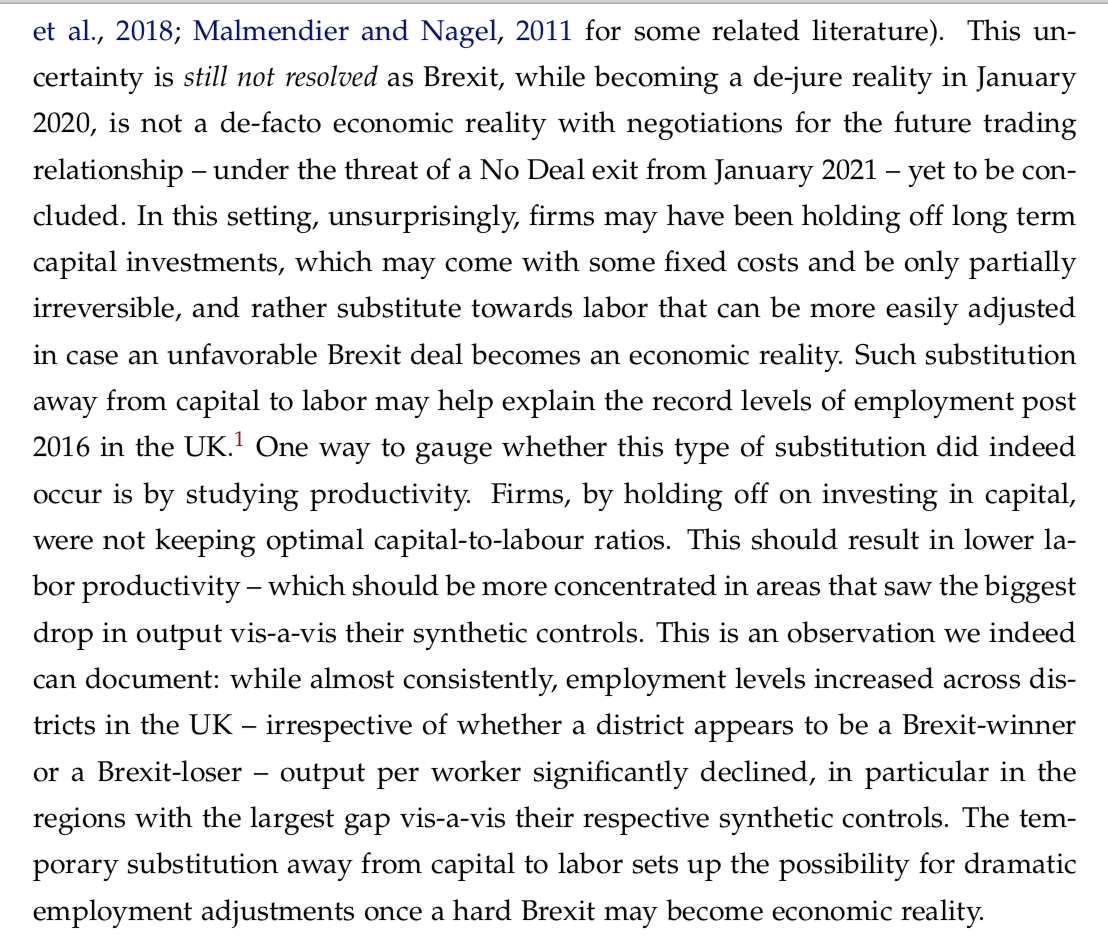
What drives the #Brexit-vote output losses? The scary observation is that the employment gains post 2016 may be perfectly rationalizable with firms increasing use of labor & reducing capital investments in response to the Brexit uncertainty 8...
This produces a picture of employment + payroll gains, despite productivity losses -- highlighting that once a No Deal #Brexit becomes reality, there may be significant layoffs as most employment gains since 2016 were temporary not supported by productivity gains 9...
May be of interest to @D_Blanchflower @ImranRasul3 @bornecon @MSchularick @chakrabortty @t0nyyates @helenbevan @BjarkeMoeller @VMRConstancio @SoumayaKeynes