I have been curious about the changes to ICU capacity capacity. The weekly data captured at healthdata.gov/sites/default/……… now shows data through the week of 12/11. At first blush, the data doesn't appear to have changed much since the prior week. 1/n Image
2/n The aspect I am most curious about is the reporting of the data. An example of this is in reporting of ICU beds available and used. See below for one PA example: It is confusing to see the beds at this facility change during the weeks of 10/2 and 9/18 #covid #hospitals Image
3/n In contrast, note the reporting at this alternative #Pennsylvania hospital: While the average total #ICU beds increase slightly during the two most recent weeks, in contrast with the prior example, this hospital shows a percentage used < 100%. #LehighValley #ABE #Bethlehem Image
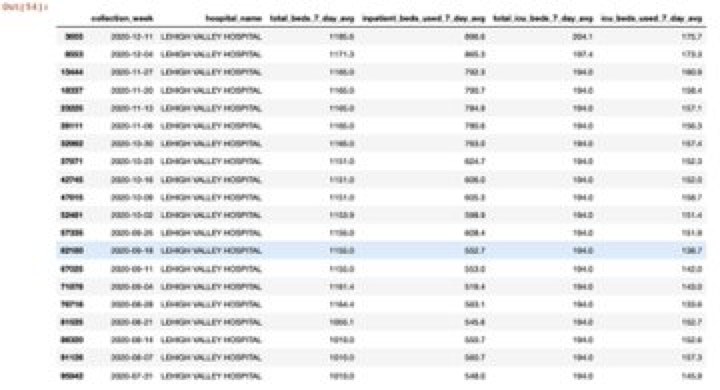
4/n [There is a data-library found at: healthdata.gov/covid-19-repor……… that indicates ICU beds are, "[t]otal number of staffed inpatient ICU beds" whereas occupancy, "[t]otal number of staffed inpatient ICU beds that are occupied." Ref. FAQ 5/6. hhs.gov/sites/default/………
5/n Here is the ICU capacity utilization distribution reported in this dataset for Pennsylvania hospitals for recent weeks, as well as from July (incl. median). I imagine I share in hope/optimism with others as #vaccines begin rollout, including in our local community. #mrna Image
6/6 In the meantime, I hope you all enjoyed a lovely holiday. I look forward to seeing you all, friends, colleagues, family, clients & prospective clients, in 2021! #postcorona #covid19 #coronavirus #benefitsconsulting #healthinsurance #healthcare #PennState #WeAre Image

• • •

Missing some Tweet in this thread? You can try to force a refresh
 

Keep Current with Jens Thorsen

Jens Thorsen Profile picture

Stay in touch and get notified when new unrolls are available from this author!

Read all threads

This Thread may be Removed Anytime!

PDF

Twitter may remove this content at anytime! Save it as PDF for later use!

Try unrolling a thread yourself!

how to unroll video
  1. Follow @ThreadReaderApp to mention us!

  2. From a Twitter thread mention us with a keyword "unroll"
@threadreaderapp unroll

Practice here first or read more on our help page!

More from @jensholger78

12 Jan
#Healthcare is just an interesting business to be a part of. I saw a fellow post details from the PSU Health website that included a bunch of information in json format. I was curious to see what the data revealed. 1/n Image
2/n The most interesting surprise, aside from specific breakdowns of variation in reimbursement per service by payer, was the specific classification for "Amish/Mennonite OP Rate". Image
Read 4 tweets
6 Jan
I was discussing #healthcare cost variation (& #EHP #RBP models) across geography with a colleague earlier today. I have followed the work of @zackcooperYale and thought it would be interesting to, in very simple terms, visualize some of the cost variation. A short thread. 1/n
2/n I started looking for a datasource. While our #benefitconsulting and #insurance clients engage networks of private insurers, that data is subject to different rules... I wondered what variation "looks like" for Medicare claims. I landed here: dartmouthatlas.org
3/n First, there is a ton of #Medicare data. It can be downloaded by state (see below) as well as to a county level (which I pulled into Python.) To consider the amount of cost attributable to different segments, I looked at the largest categories with observations by county. ImageImage
Read 9 tweets

Did Thread Reader help you today?

Support us! We are indie developers!


This site is made by just two indie developers on a laptop doing marketing, support and development! Read more about the story.

Become a Premium Member ($3/month or $30/year) and get exclusive features!

Become Premium

Too expensive? Make a small donation by buying us coffee ($5) or help with server cost ($10)

Donate via Paypal Become our Patreon

Thank you for your support!

Follow Us on Twitter!