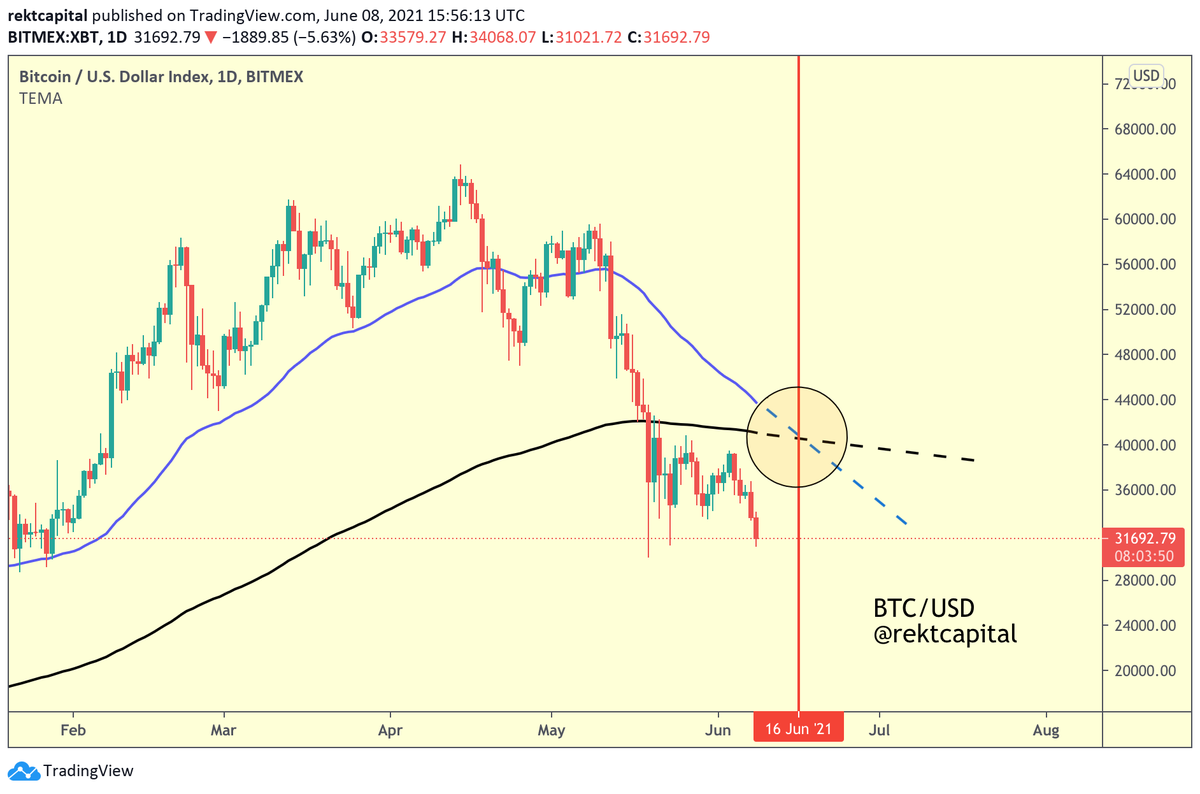
#BTC is on the cusp of a potential Death Cross
But could the #Bitcoin Death Cross invalidate the Stock to Flow model?
Here's a thread with my thoughts about the $BTC Death Cross in the context of the Stock to Flow model:
But could the #Bitcoin Death Cross invalidate the Stock to Flow model?
Here's a thread with my thoughts about the $BTC Death Cross in the context of the Stock to Flow model:
1.
Whenever a Death Cross occurs, #Bitcoin experiences deeper downside
In 2014, a Death Cross preceded an extra -71% drop
In 2017, an extra -65% drop
In 2019, an extra -55% drop
For more info about the Death Cross, checkout my previous thread:

Whenever a Death Cross occurs, #Bitcoin experiences deeper downside
In 2014, a Death Cross preceded an extra -71% drop
In 2017, an extra -65% drop
In 2019, an extra -55% drop
For more info about the Death Cross, checkout my previous thread:
https://twitter.com/rektcapital/status/1399735515767787521?s=20


2.
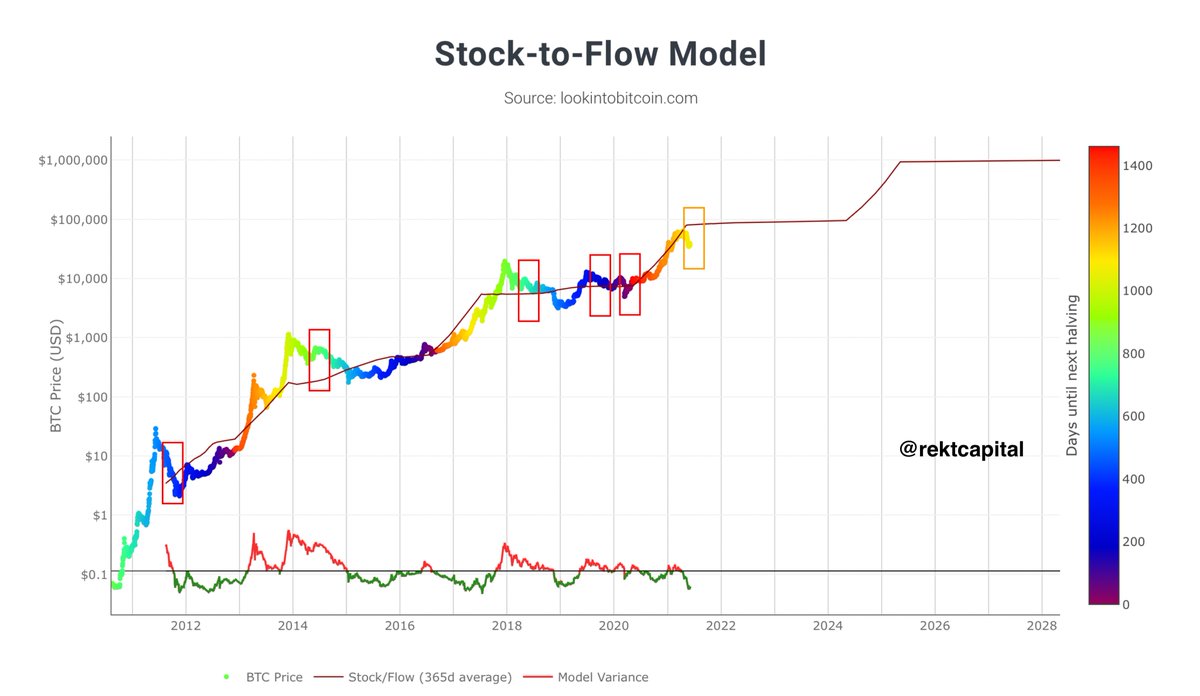
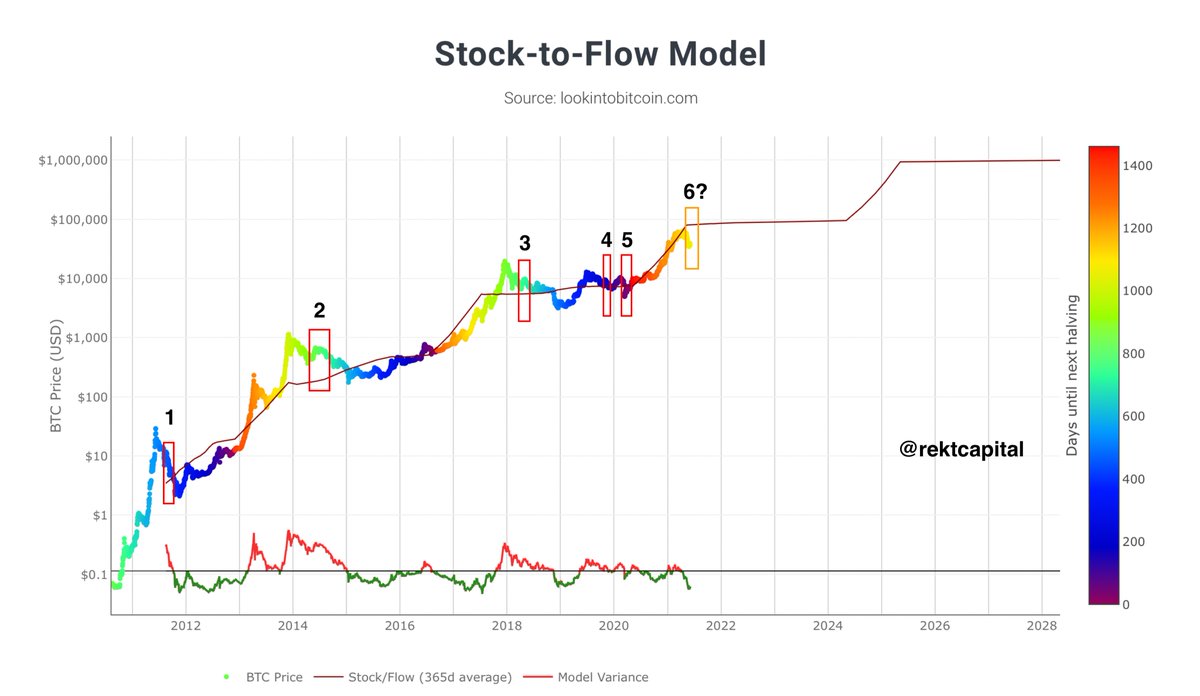
But can a #BTC Death Cross invalidate the Stock to Flow model?
Here are all the $BTC Death Crosses shown on the Stock to Flow model in red:
But can a #BTC Death Cross invalidate the Stock to Flow model?
Here are all the $BTC Death Crosses shown on the Stock to Flow model in red:
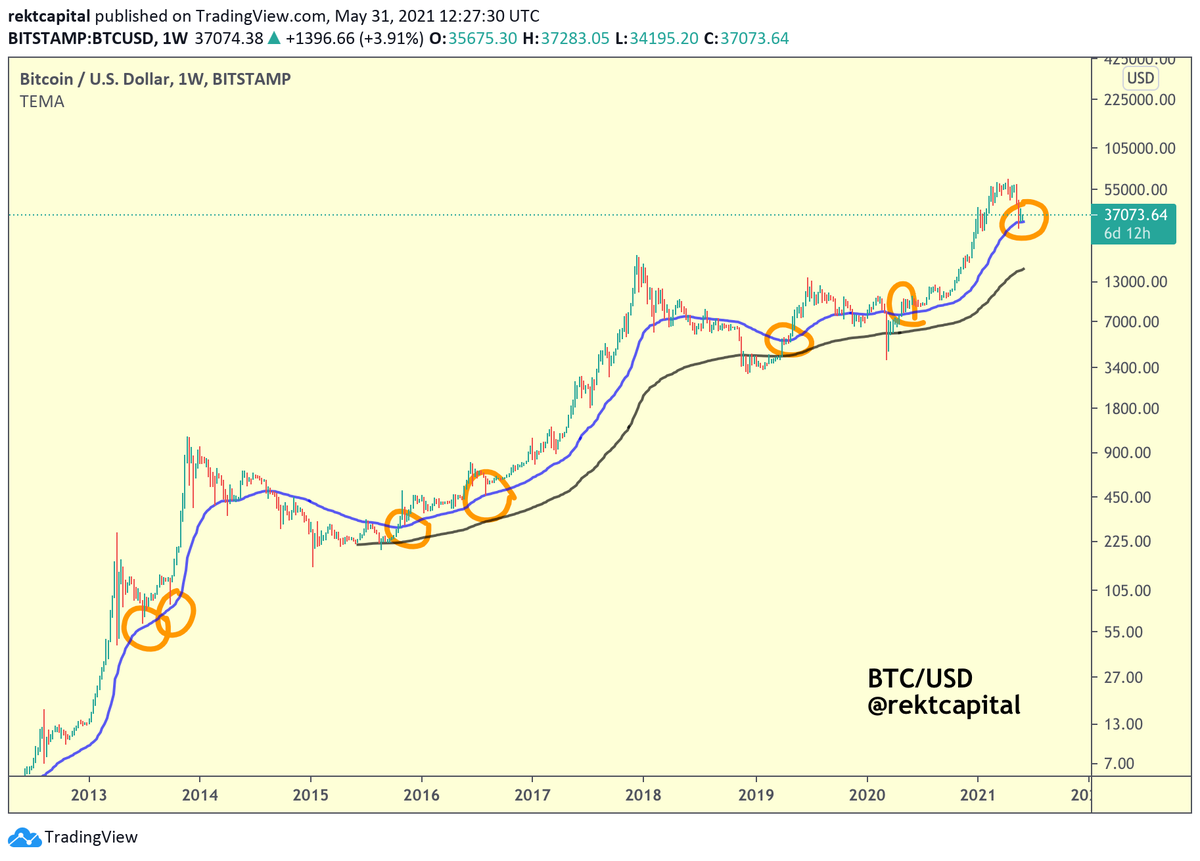
3.
Generally, #BTC Death Crosses tend to precede further downside (with the exception of March 2020)
In the context of the S2F model, when Death Crosses occur...
Bitcoin goes BELOW the Stock to Flow line (brown)
What does this mean?
Generally, #BTC Death Crosses tend to precede further downside (with the exception of March 2020)
In the context of the S2F model, when Death Crosses occur...
Bitcoin goes BELOW the Stock to Flow line (brown)
What does this mean?

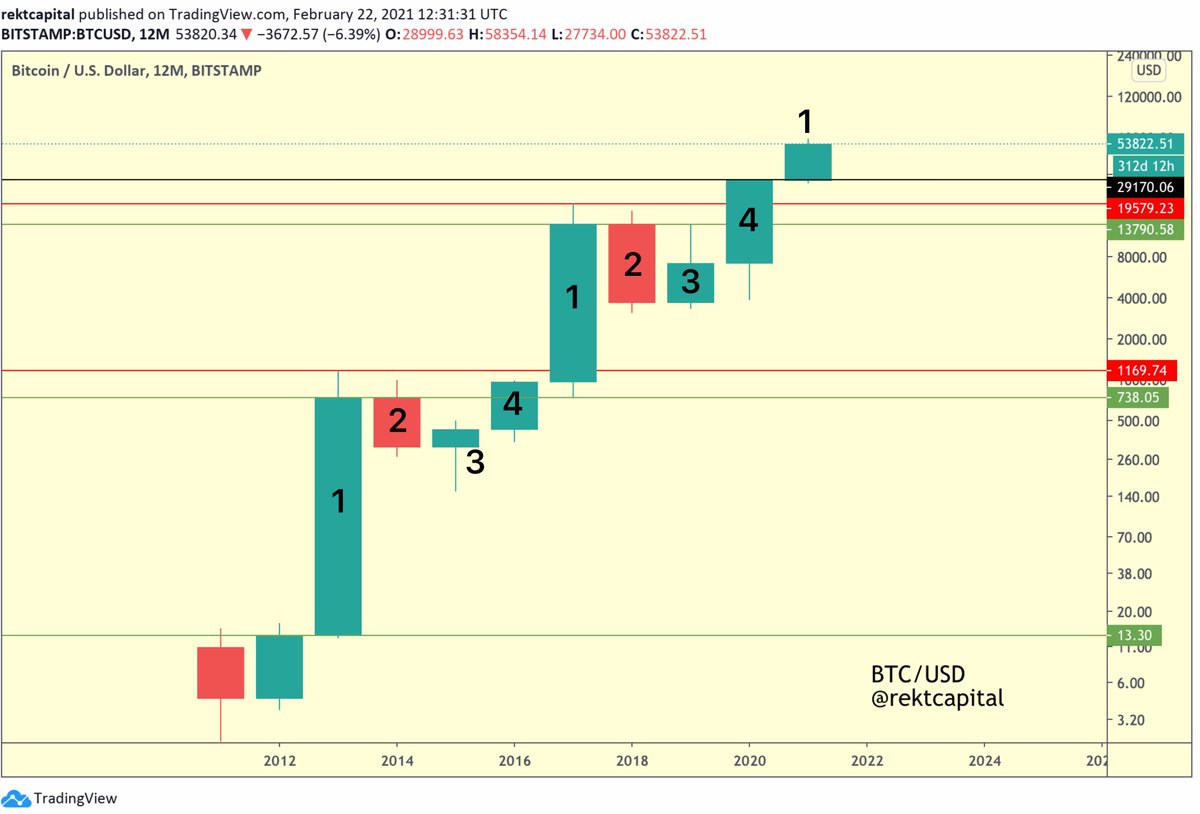
4.
The Stock to Flow line is a great reference point for #BTC's price
Upside deviations beyond the S2F line precede Bull Market Tops
Downside deviations below the S2F line precede Bear Market Bottoms
(Check out my newsletter about upside deviations):
rektcapital.substack.com/p/stock-to-flo…
The Stock to Flow line is a great reference point for #BTC's price
Upside deviations beyond the S2F line precede Bull Market Tops
Downside deviations below the S2F line precede Bear Market Bottoms
(Check out my newsletter about upside deviations):
rektcapital.substack.com/p/stock-to-flo…
5.
When a Death Cross occurs, #BTC goes below the S2F line
Downside deviations below the S2F line highlight periods of great financial opportunity
Why?
$BTC tends to form accumulation ranges below the S2F line
BTC later breaks out from these ranges into new macro uptrends
When a Death Cross occurs, #BTC goes below the S2F line
Downside deviations below the S2F line highlight periods of great financial opportunity
Why?
$BTC tends to form accumulation ranges below the S2F line
BTC later breaks out from these ranges into new macro uptrends

6.
In 2011, a Death Cross preceded a #BTC revisit below the S2F line to form a V-Shaped bottom before entering a new macro uptrend
In 2014 & 2018, Death Crosses preceded a $BTC revisit below the S2F but this time to form extended accumulation ranges before new macro uptrends
In 2011, a Death Cross preceded a #BTC revisit below the S2F line to form a V-Shaped bottom before entering a new macro uptrend
In 2014 & 2018, Death Crosses preceded a $BTC revisit below the S2F but this time to form extended accumulation ranges before new macro uptrends

7.
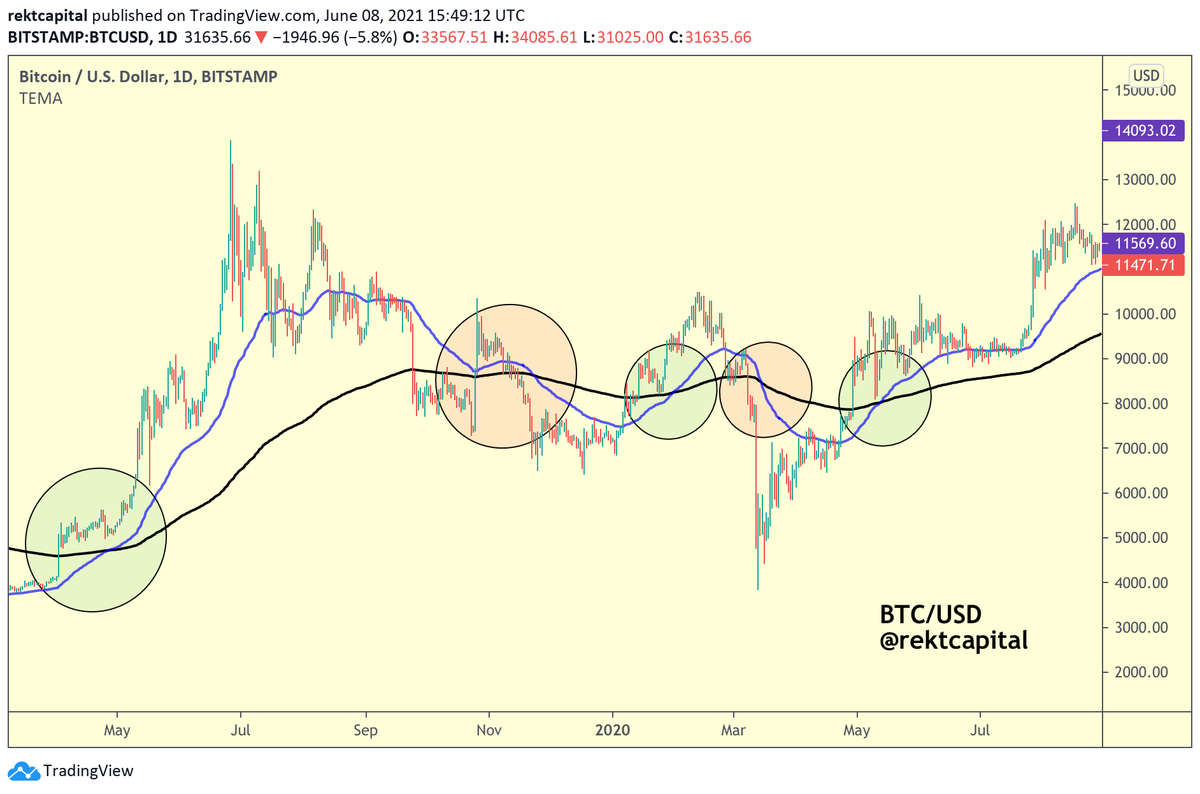
In 2019 & 2020 though the DC effect on #BTC was much different
In Nov 2019, the DC led to only a -10% drop
In March 2020, the DC actually marked the generational bottom
In periods of macro accumulation, the EMAs will oscillate & perform trendless Golden & Death Crossovers
In 2019 & 2020 though the DC effect on #BTC was much different
In Nov 2019, the DC led to only a -10% drop
In March 2020, the DC actually marked the generational bottom
In periods of macro accumulation, the EMAs will oscillate & perform trendless Golden & Death Crossovers
8.
But even though these Death Crosses didn't precede much upside as they historically tend to...
In the context of the S2F line, the Death Crosses in periods 4 & 5 occurred shortly before $BTC bottomed below the S2F line
But even though these Death Crosses didn't precede much upside as they historically tend to...
In the context of the S2F line, the Death Crosses in periods 4 & 5 occurred shortly before $BTC bottomed below the S2F line

9.
In period 4 (i.e. November 2019), #BTC bottomed briefly before going back above the S2F line before further downside
And then $BTC bottomed in March 2020 to form a V-Shaped recovery into a new macro uptrend and new Bull Market
Here's a crucial point that needs to be made:
In period 4 (i.e. November 2019), #BTC bottomed briefly before going back above the S2F line before further downside
And then $BTC bottomed in March 2020 to form a V-Shaped recovery into a new macro uptrend and new Bull Market
Here's a crucial point that needs to be made:

10.
#BTC Death Cross generally precedes extra downside
But even more frequently, they precede a $BTC drop below the Stock to Flow line
When BTC does this, it means it's getting closer to a bottom
Whether that bottom precedes a new accumulation range or a V-Shaped recovery...
#BTC Death Cross generally precedes extra downside
But even more frequently, they precede a $BTC drop below the Stock to Flow line
When BTC does this, it means it's getting closer to a bottom
Whether that bottom precedes a new accumulation range or a V-Shaped recovery...
11.
#BTC below the Stock to Flow line means that the point of maximum financial opportunity is getting closer
All things considered now, how should we think about this current period where $BTC may soon perform a Death Cross?
#Bitcoin
#BTC below the Stock to Flow line means that the point of maximum financial opportunity is getting closer
All things considered now, how should we think about this current period where $BTC may soon perform a Death Cross?
#Bitcoin
12.
With a new Death Cross looming large, #BTC already finds itself below the Stock to Flow line
In that respect, $BTC in its current period (i.e. 6) is similar to periods 1, 4, and 5
In these periods, a Death Cross occurred when BTC was already below the Stock to Flow line
With a new Death Cross looming large, #BTC already finds itself below the Stock to Flow line
In that respect, $BTC in its current period (i.e. 6) is similar to periods 1, 4, and 5
In these periods, a Death Cross occurred when BTC was already below the Stock to Flow line
13.
And whenever #BTC is below the S2F line, BTC tends to form a bottom
Whether that's via a V-Shaped reversal...
Or an entire sideways accumulation range
With $BTC currently below the S2F line, this means that BTC is reaching levels where it is considered undervalued
And whenever #BTC is below the S2F line, BTC tends to form a bottom
Whether that's via a V-Shaped reversal...
Or an entire sideways accumulation range
With $BTC currently below the S2F line, this means that BTC is reaching levels where it is considered undervalued

14.
The #BTC Death Cross won't invalidate the S2F model
But the DC could signal extra downside that $BTC needs to do to reach the point of max. financial opportunity
According to the S2F model, BTC is already undervalued
Question is - where is peak opportunity (i.e. bottom)?
The #BTC Death Cross won't invalidate the S2F model
But the DC could signal extra downside that $BTC needs to do to reach the point of max. financial opportunity
According to the S2F model, BTC is already undervalued
Question is - where is peak opportunity (i.e. bottom)?
15.
Once #BTC finishes its correction to reach its point of max financial opportunity...
#Bitcoin could form a V-Shaped reversal or an accumulation range yet again to begin a new macro uptrend that will bring BTC above the S2F line where BTC will finally peak in its Bull Market
Once #BTC finishes its correction to reach its point of max financial opportunity...
#Bitcoin could form a V-Shaped reversal or an accumulation range yet again to begin a new macro uptrend that will bring BTC above the S2F line where BTC will finally peak in its Bull Market
16.
This type of extensive analysis is something I only share in the Rekt Capital Newsletter
So if you liked this thread - you'll love the newsletter
Feel free to sign up for regular cutting-edge insights on #BTC and Altcoins:
rektcapital.substack.com
#Crypto #Bitcoin
This type of extensive analysis is something I only share in the Rekt Capital Newsletter
So if you liked this thread - you'll love the newsletter
Feel free to sign up for regular cutting-edge insights on #BTC and Altcoins:
rektcapital.substack.com
#Crypto #Bitcoin
• • •
Missing some Tweet in this thread? You can try to
force a refresh