Many Liverpool fans are unhappy that their club has not bought more players in this summer’s transfer window. This thread looks at where the money has gone, reviews the #LFC business model under FSG and explains why the approach is less restrained at other clubs.
This summer #LFC only spent £36m on RB Leipzig defender Ibrahim Konaté, by far the lowest of the Big Six. Four clubs splashed out more than £100m:#AFC £149m, #MUFC £126m, #MCFC £115m and #CFC £108m. On a net basis, #LFC £11m was second smallest, as #CFC made £110m sales. 

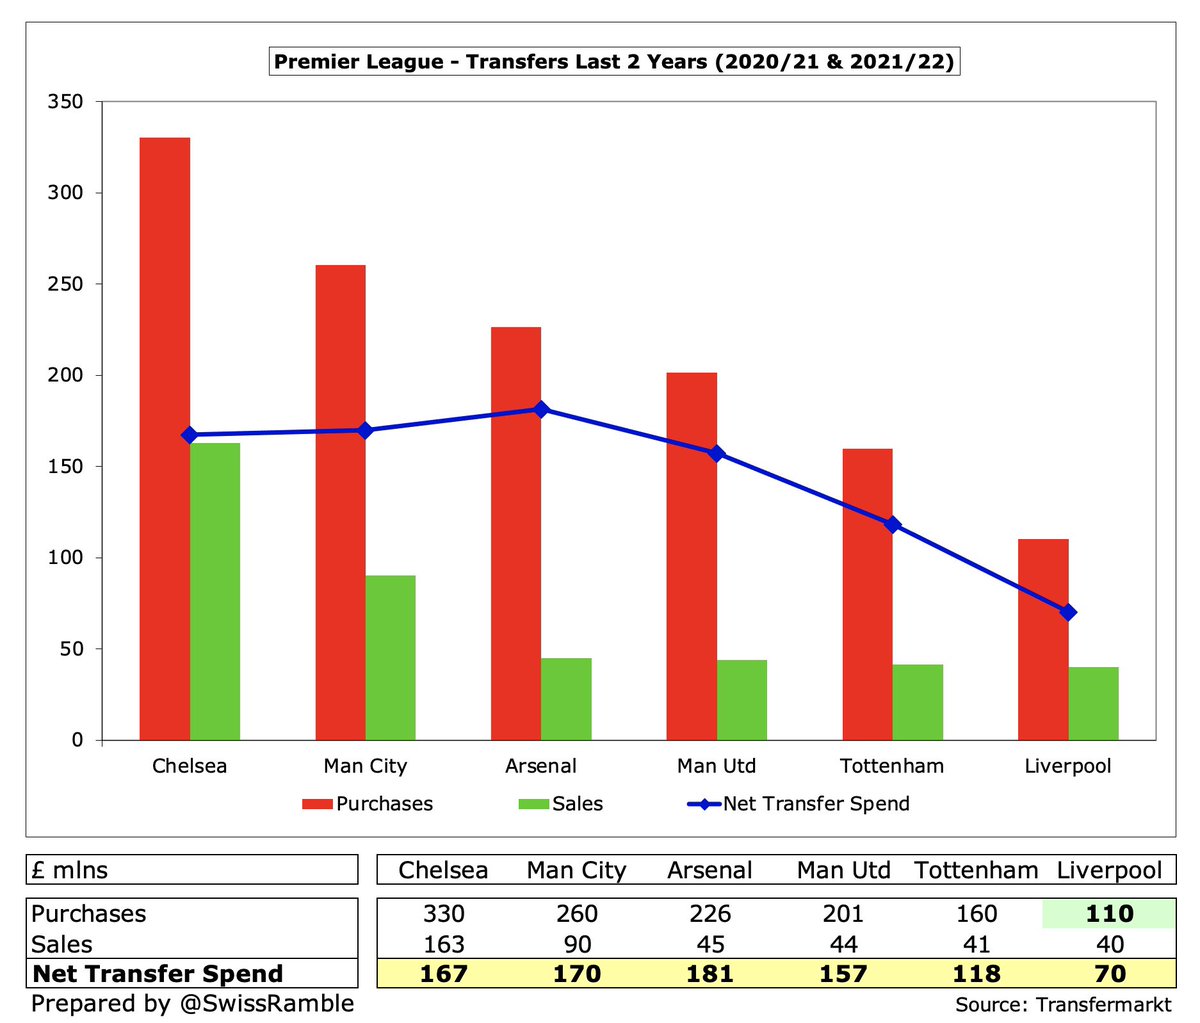
Even though #LFC spent £74m the prior season, mainly on Jota, Thiago & Tsimikas, their £110m gross spend in the last two years is still the lowest of the Big Six, far below #CFC £330m, #MCFC £260m, #AFC £226m. #MUFC £201m and #THFC £160m. Liverpool also had the lowest net spend. 
It’s a similar story when comparing #LFC with leading European clubs over past 2 years, though their £110m gross spend is only £4m less than Barcelona £114m and £82m more than Real Madrid. On a net basis, the Reds have spent nearly as much (£70m) as Bayern Munich £88m. 


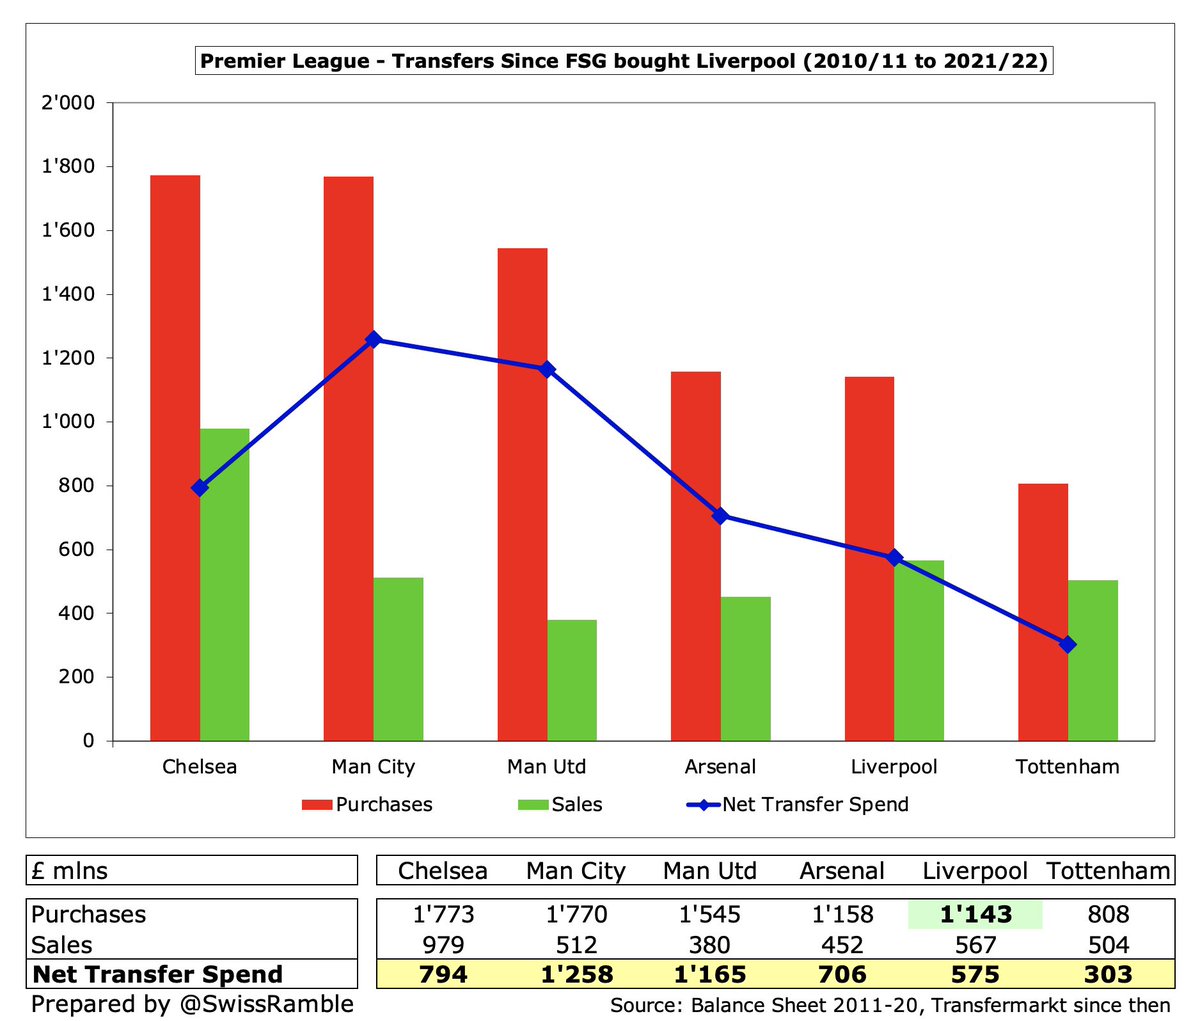
Looking at transfers since FSG acquired the club in October 2010, #LFC had £1.1 bln gross spend (£575m net), but they have been significantly outpaced by #CFC £1.8 bln, #MCFC £1.8 bln and #MUFC £1.5 bln. In other words, this disparity is nothing new for Liverpool. 
This is somewhat puzzling to #LFC fans, given their success on the pitch (Champions League winners 2019, Premier League title 2020), so let’s look at their financials since FSG arrived. The last published accounts were for 2019/20, so this review covers 10 years from 2010/11. 

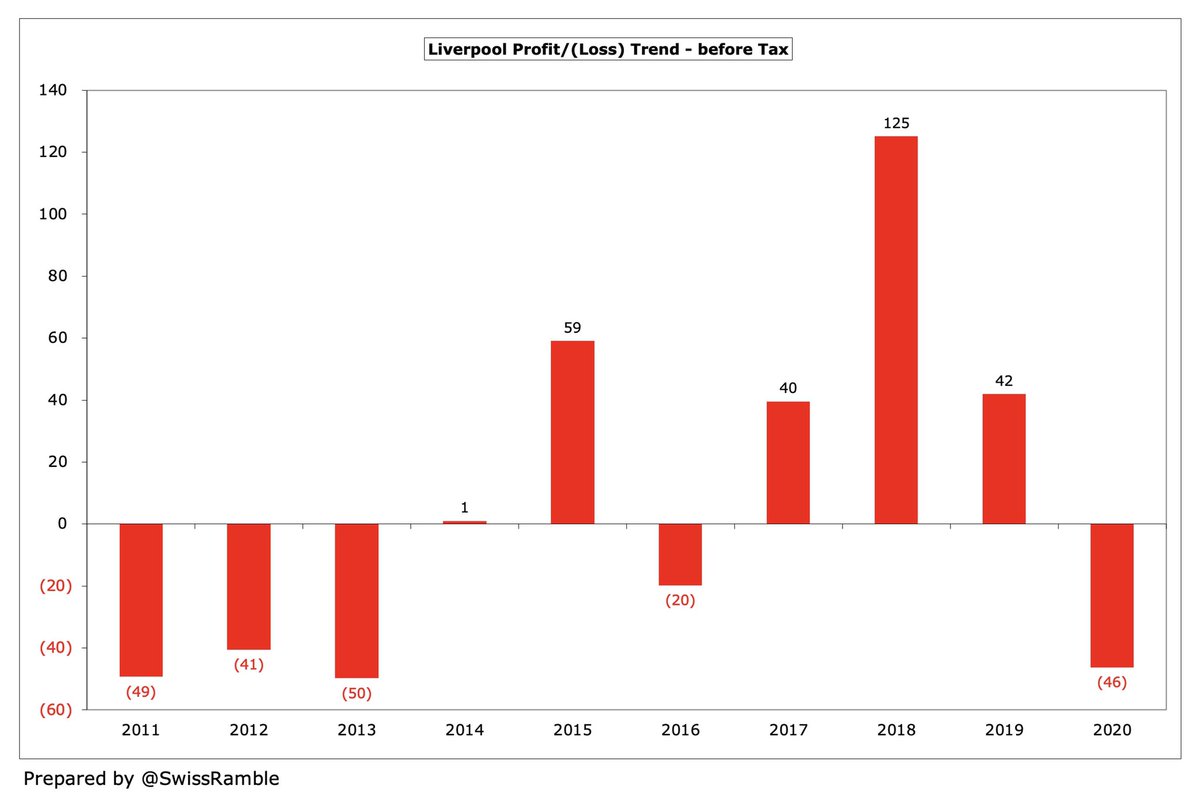
In the last 10 years, #LFC made £61m pre-tax profit, though this is a “game of two halves”, as first 5 years delivered £80m losses, offset by £141m profits in last 5 years, despite big £46m loss in 2020. Nevertheless, still less than half #THFC £338m, #MUFC £191m and #AFC £112m. 

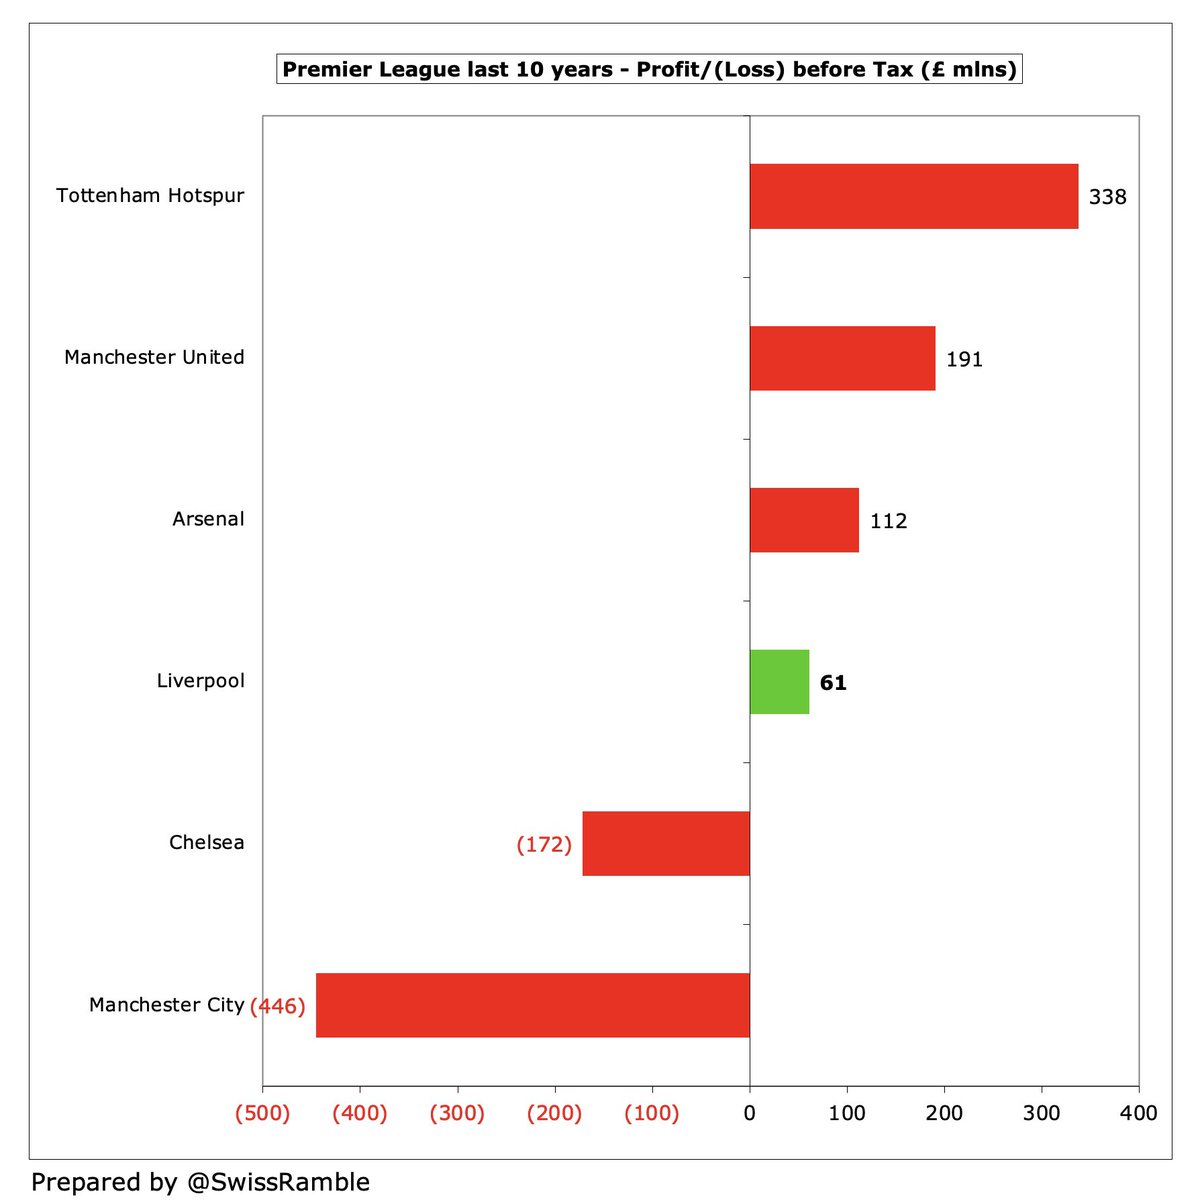
However, worth noting that this £61m pre-tax profit is entirely due to £359m profit on player sales. Excluding these profits, #LFC would have made a large loss. #LFC have spent more than they earned on expenses: revenue £3,257m less operating expenses £3,517m plus interest £42m. 

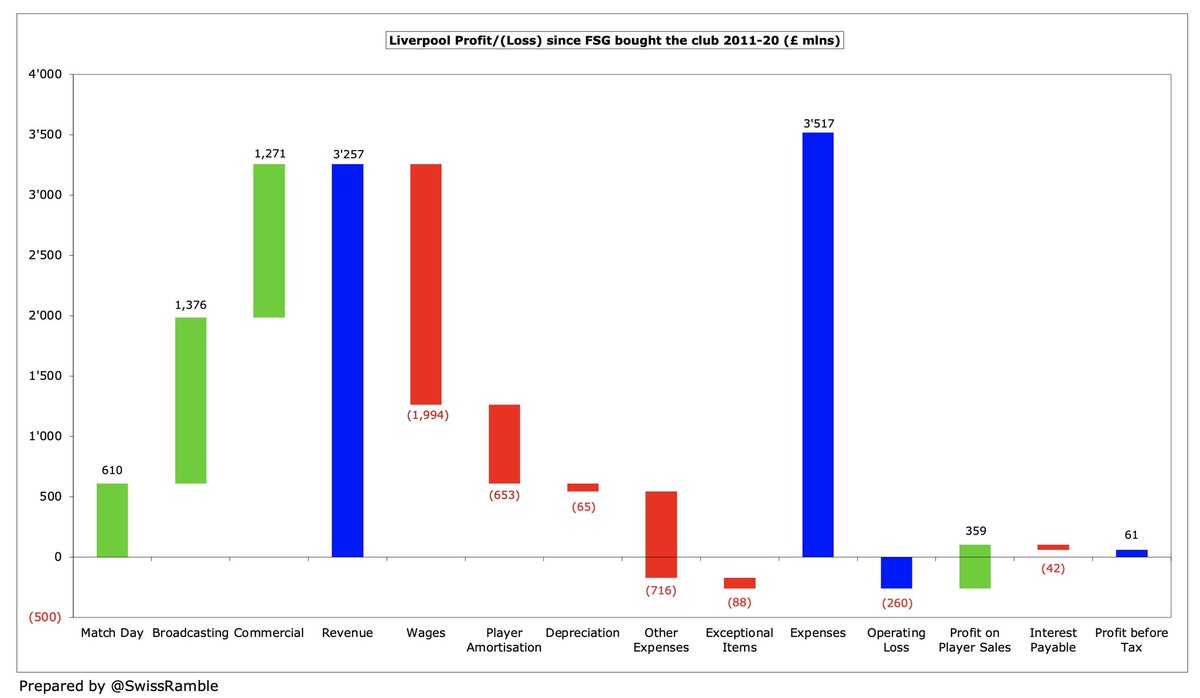

To reinforce this point, #LFC operating loss was £260m in last 10 years. Even in the highly profitable 2019, operating profit was just £1m. That said, most football clubs lose money at the operating level, though #MUFC and #THFC are exceptions with £402m and £109m respectively. 


Player sales have been an important part of #LFC strategy, generating £359m profits in the last 10 years, including £124m in 2019. Only surpassed by #CFC £602m, but significantly higher than #MCFC £208m and #MUFC £117m. In short, Liverpool are very reliant on player trading. 


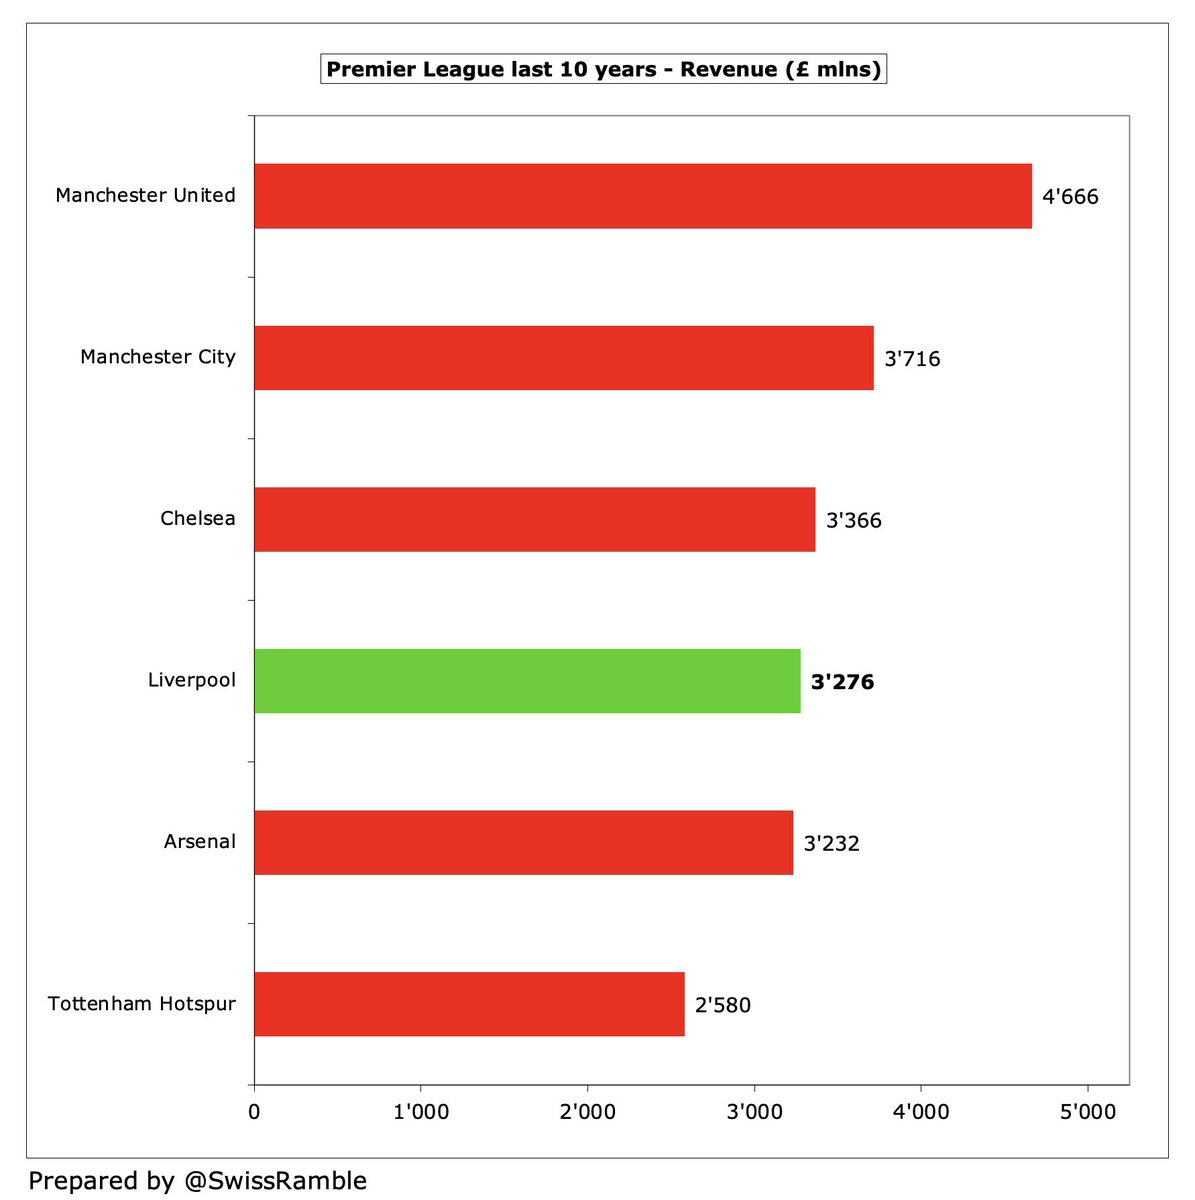
#LFC revenue has shot up by £306m (167%) in last 10 years from £184m to £490m, the 2nd highest in England only behind #MUFC £509m. Also the 2nd highest growth in this period, only below #MCFC. However, over 10 years their £3.3 bln revenue is comfortably less than #MUFC £4.7 bln. 


In fact, #LFC £490m is 5th highest revenue in the world per the Deloitte Money League, which is the first time they have been in the top five since back in 2002 and means they have improved 4 places since 2011. However, still miles behind Barcelona and Real Madrid, both £627m. 

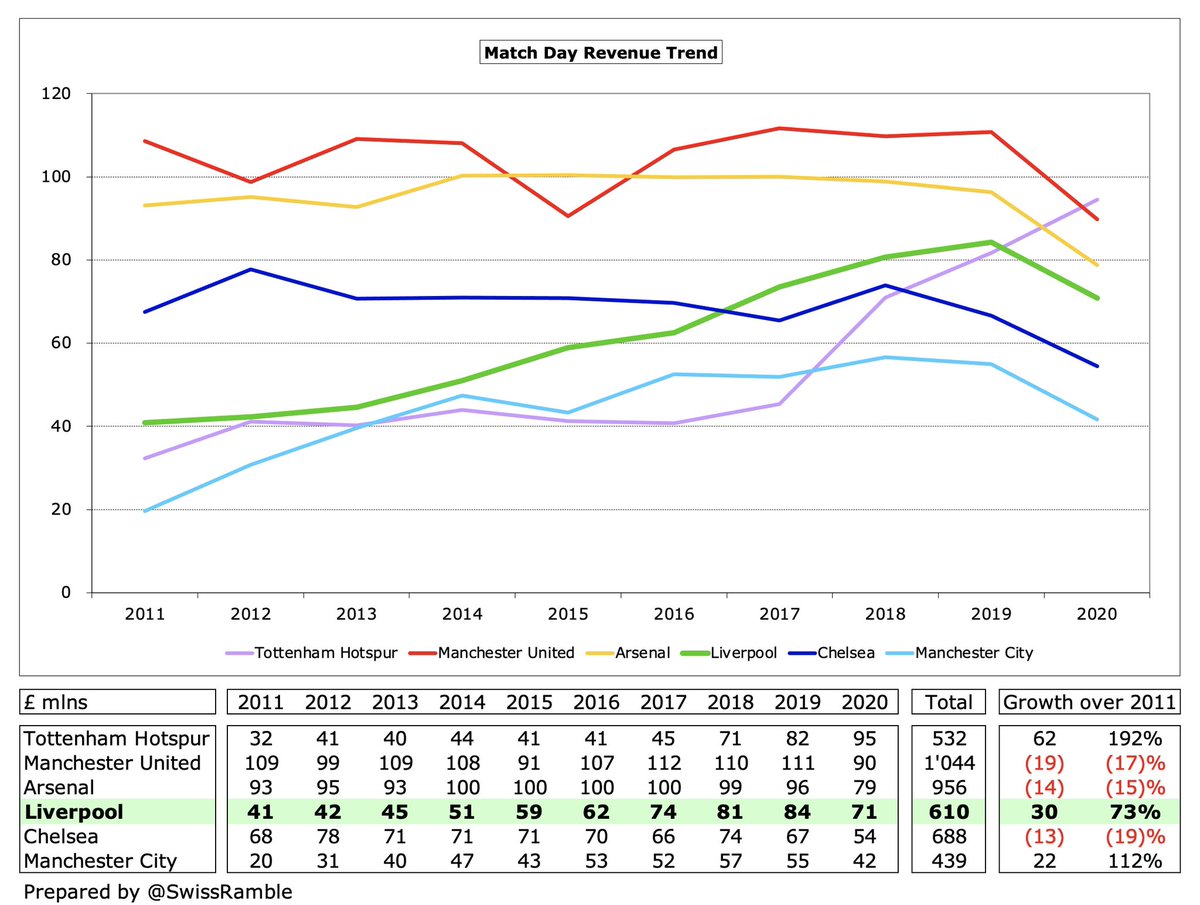
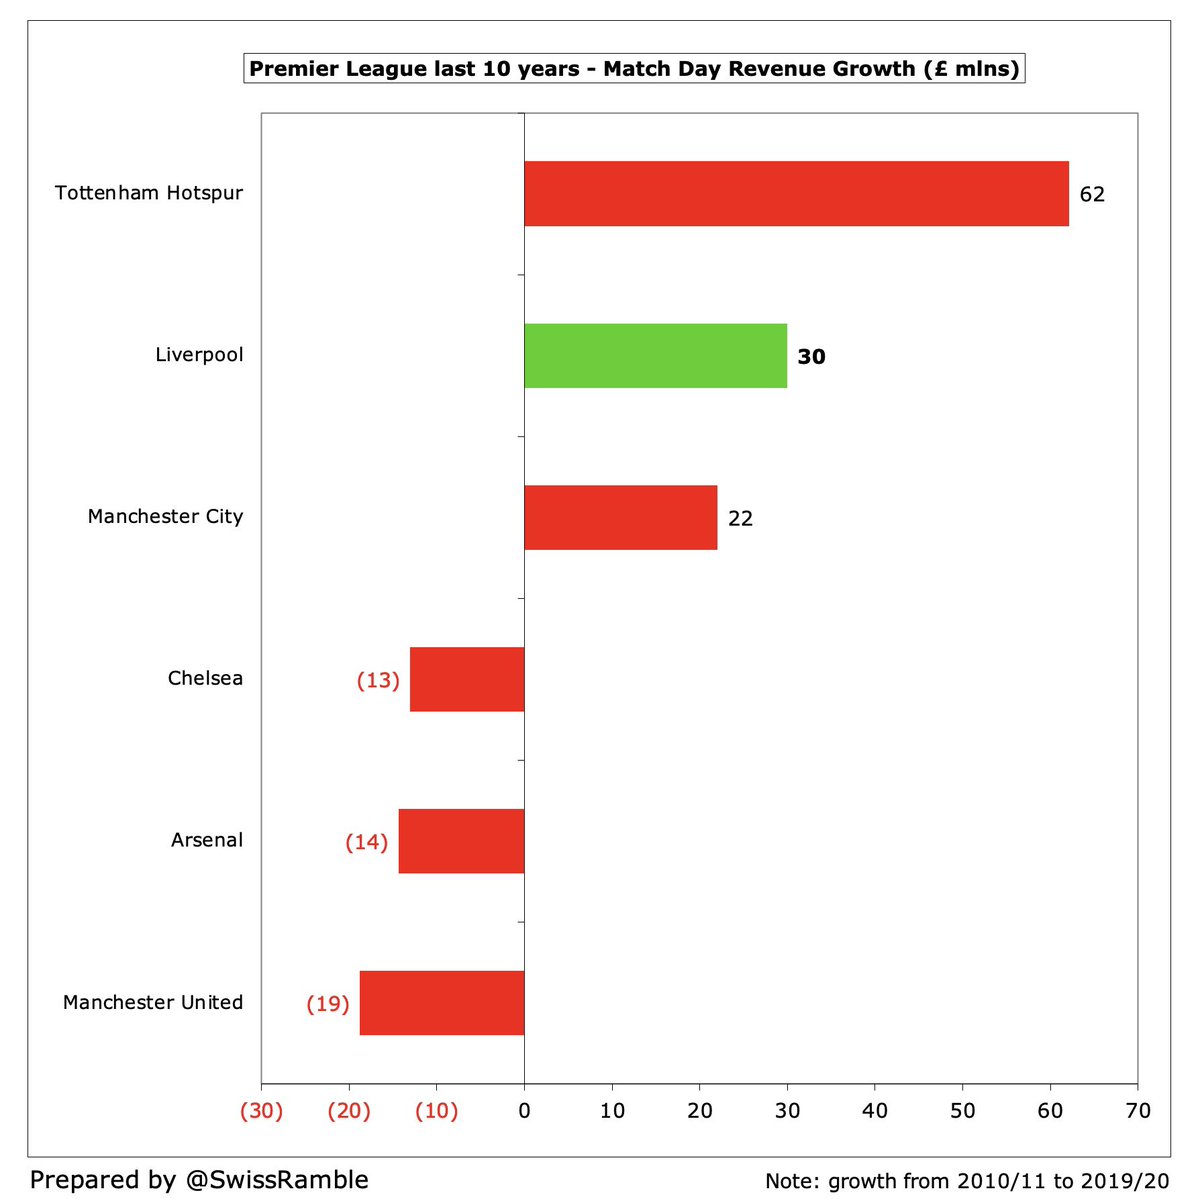
#LFC match day revenue has grown £30m (73%) in last 10 years from £41m to £71m, mainly due to expansion of Anfield’s Main Stand. Would have been higher without some games played behind closed doors in 2020. Growth only below #THFC (new stadium), but still just 4th highest in PL. 


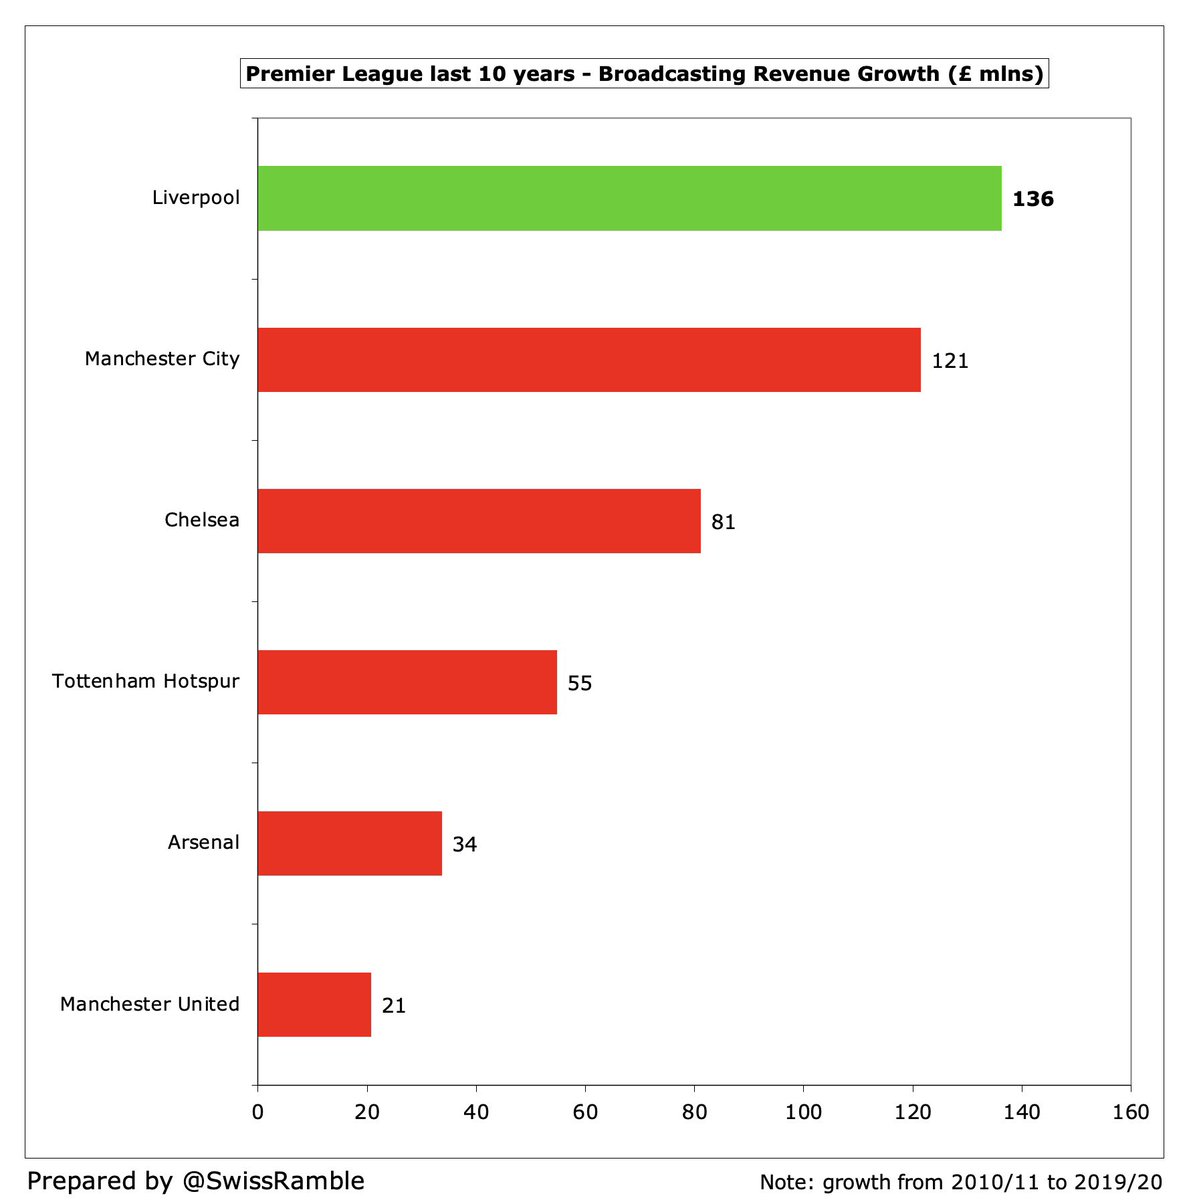
#LFC broadcasting revenue has more than tripled since 2011, rising £136m from £66m to £202m, the highest growth of the Big Six. The 2020 revenue was significantly impacted by COVID rebates and revenue deferred to 2020/21 accounts for games played after 31st May accounting close. 


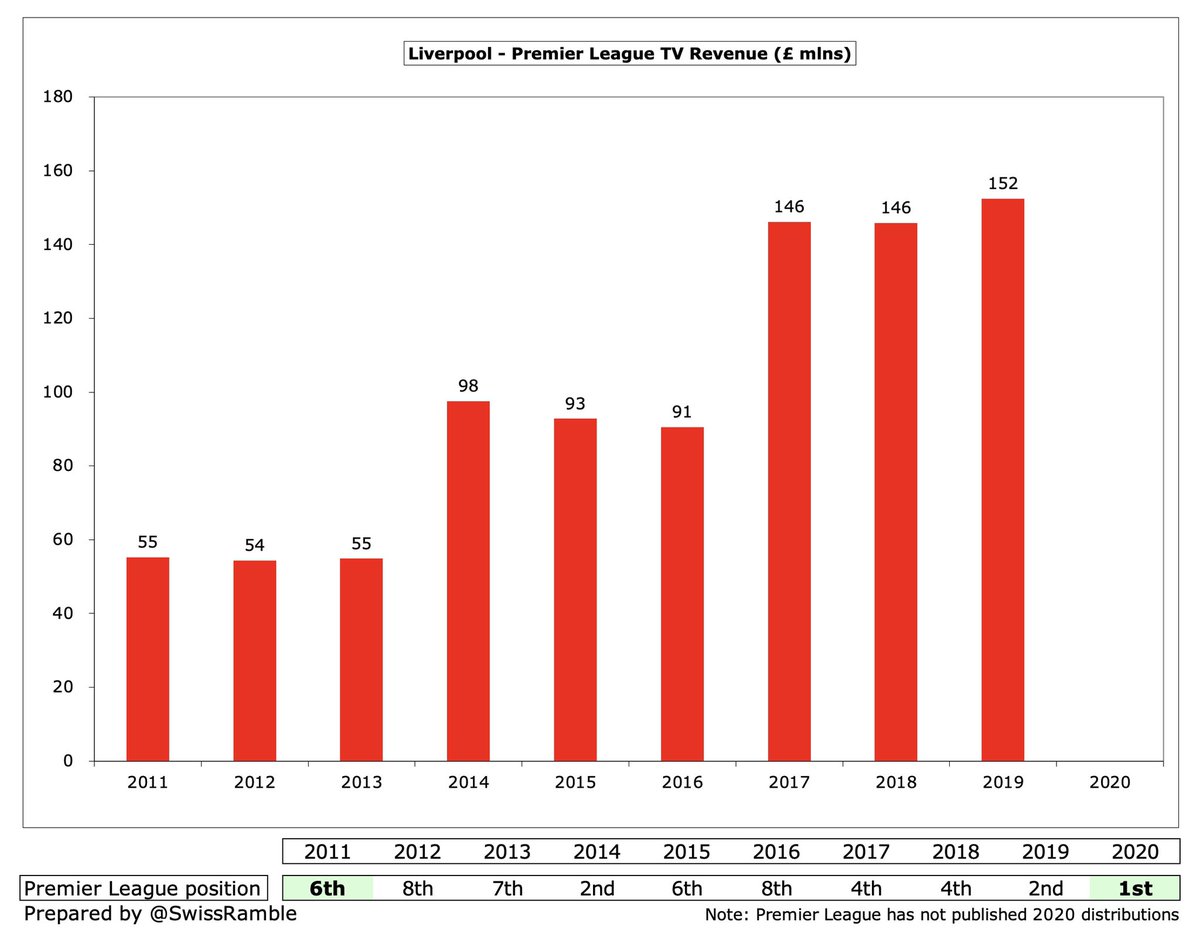
The Premier League has not published details of 2020 TV money distributions, but #LFC grew by £97m from £55m to £152m in 2019, mainly due to new central deals, but also better merit payments. However, as Warren Buffet said, this is a case of “A rising tide floats all boats” 


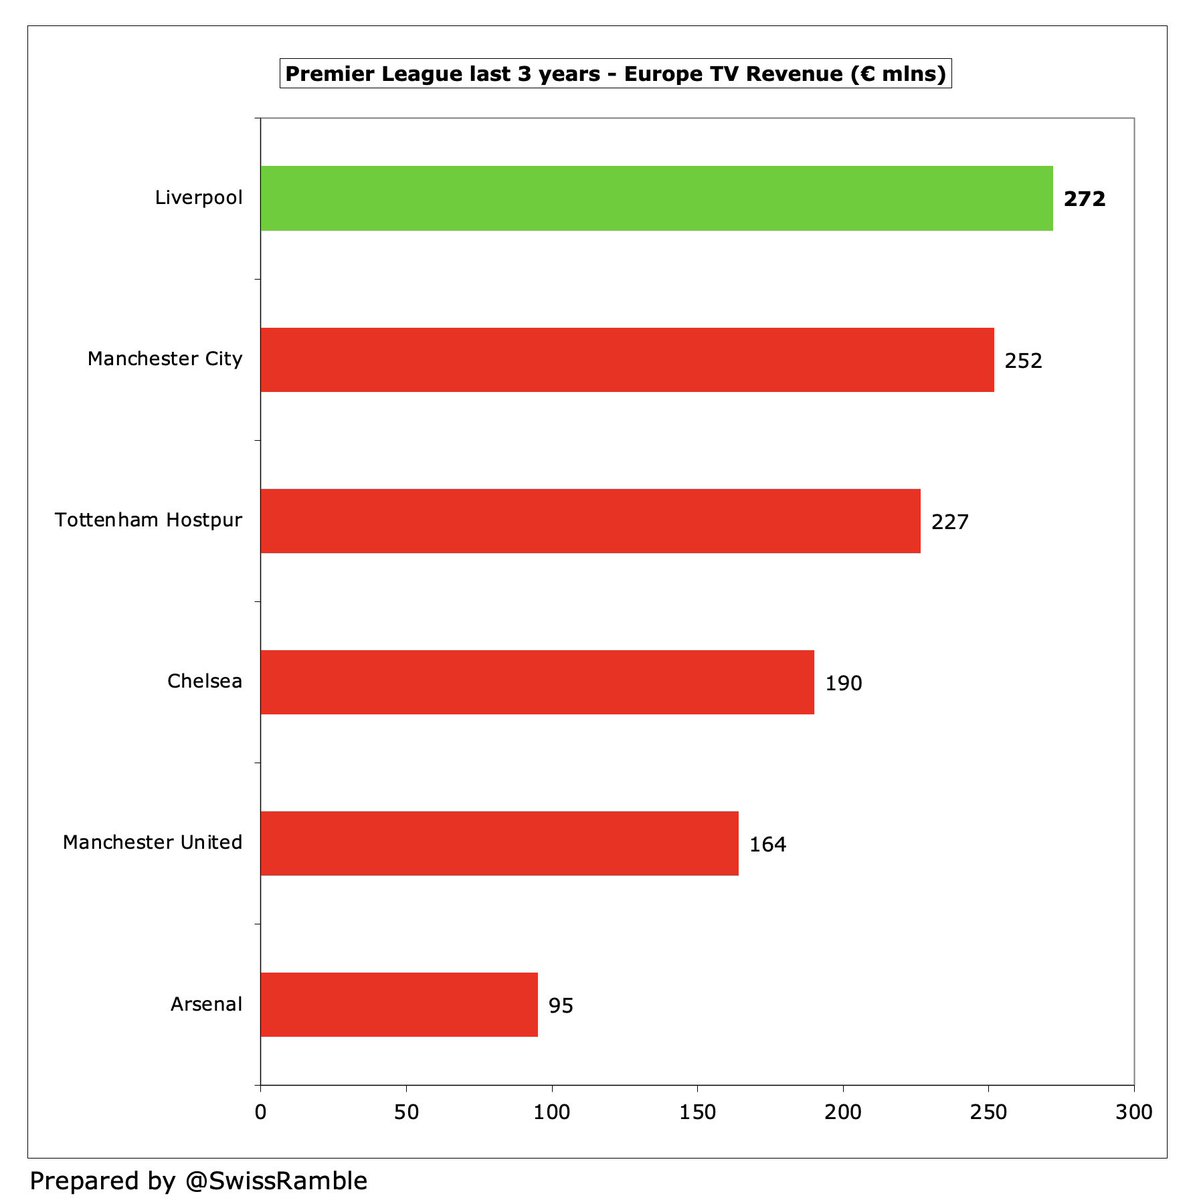
European TV money has seen massive growth with #LFC earning an impressive €272m in the last 3 years, more than any other English club, having won the Champions League and reached the final in this period. I estimate they also got €89m in 2021, so CL qualification is imperative. 


In the last 10 years #LFC commercial income has grown by £140m from £77m to £217m, due to new sponsorship deals and higher retail sales. #MUFC have been flat over last 4 years, but still earned almost £900m more than the Reds in the decade, while #MCFC were over £500m higher. 


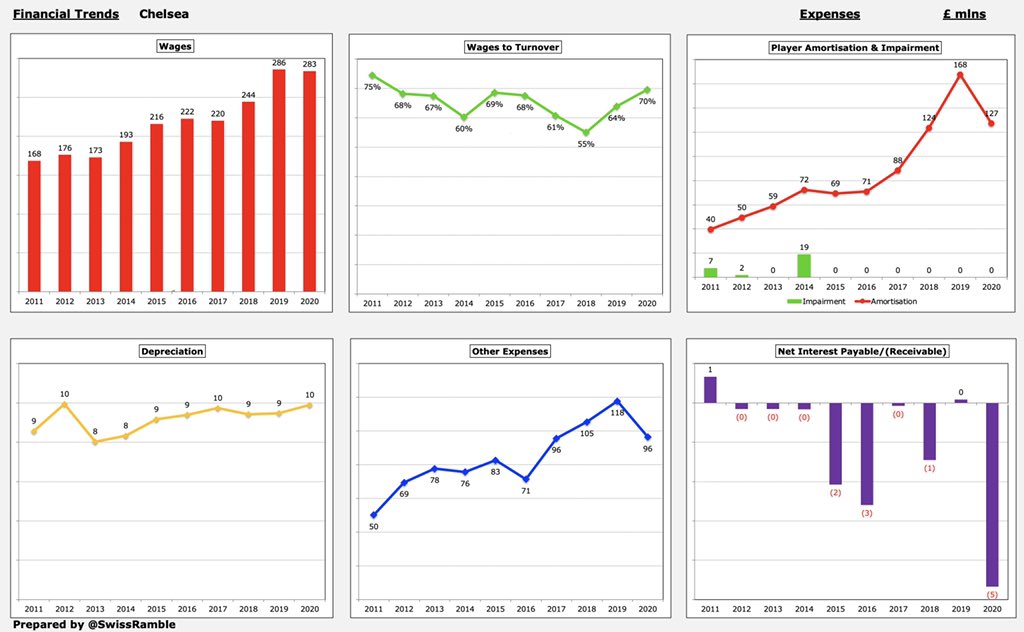
However, here’s the thing. All of the revenue growth has been eaten up by higher costs. In fact. #LFC wages have grown by £197m since 2011, the highest in the Big Six, due to recruiting better quality players and higher bonus payments. The focus has been on extending contracts. 


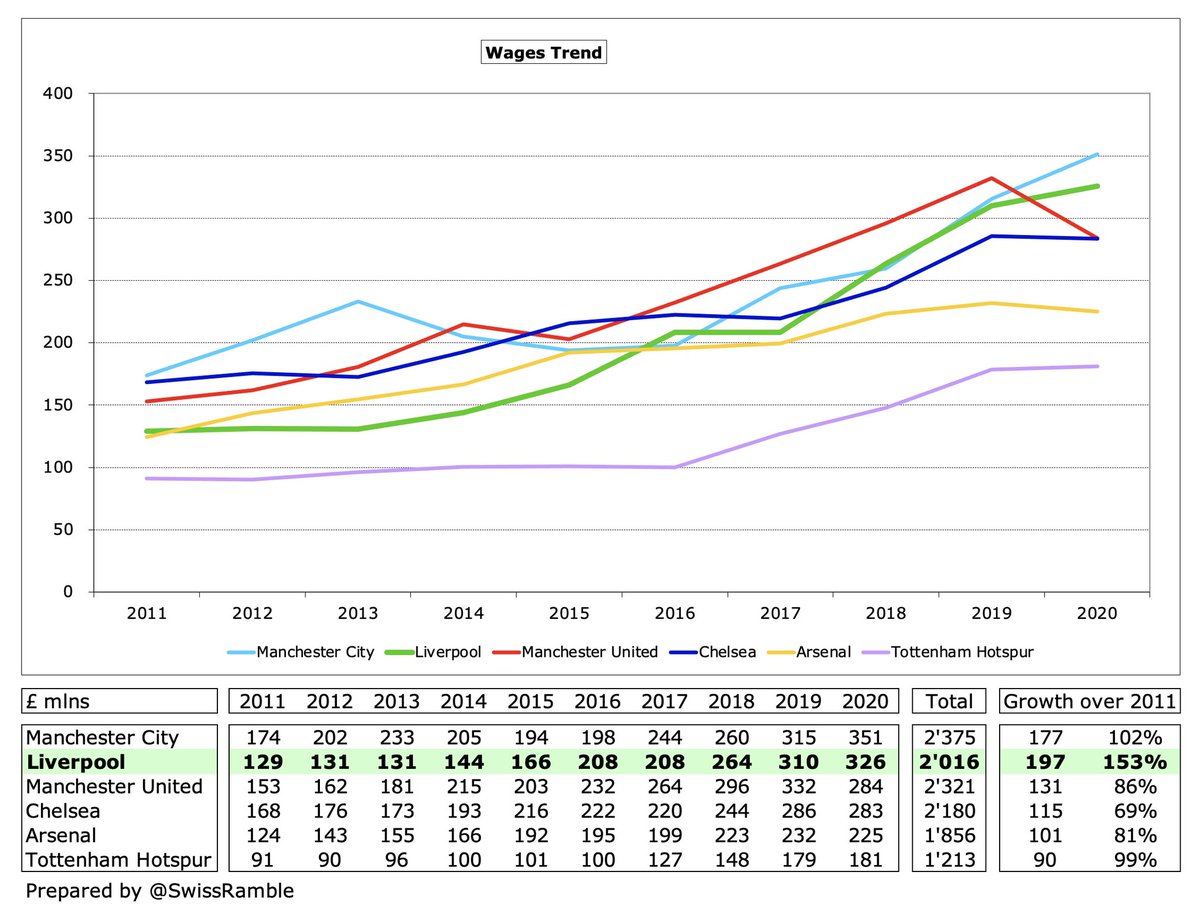

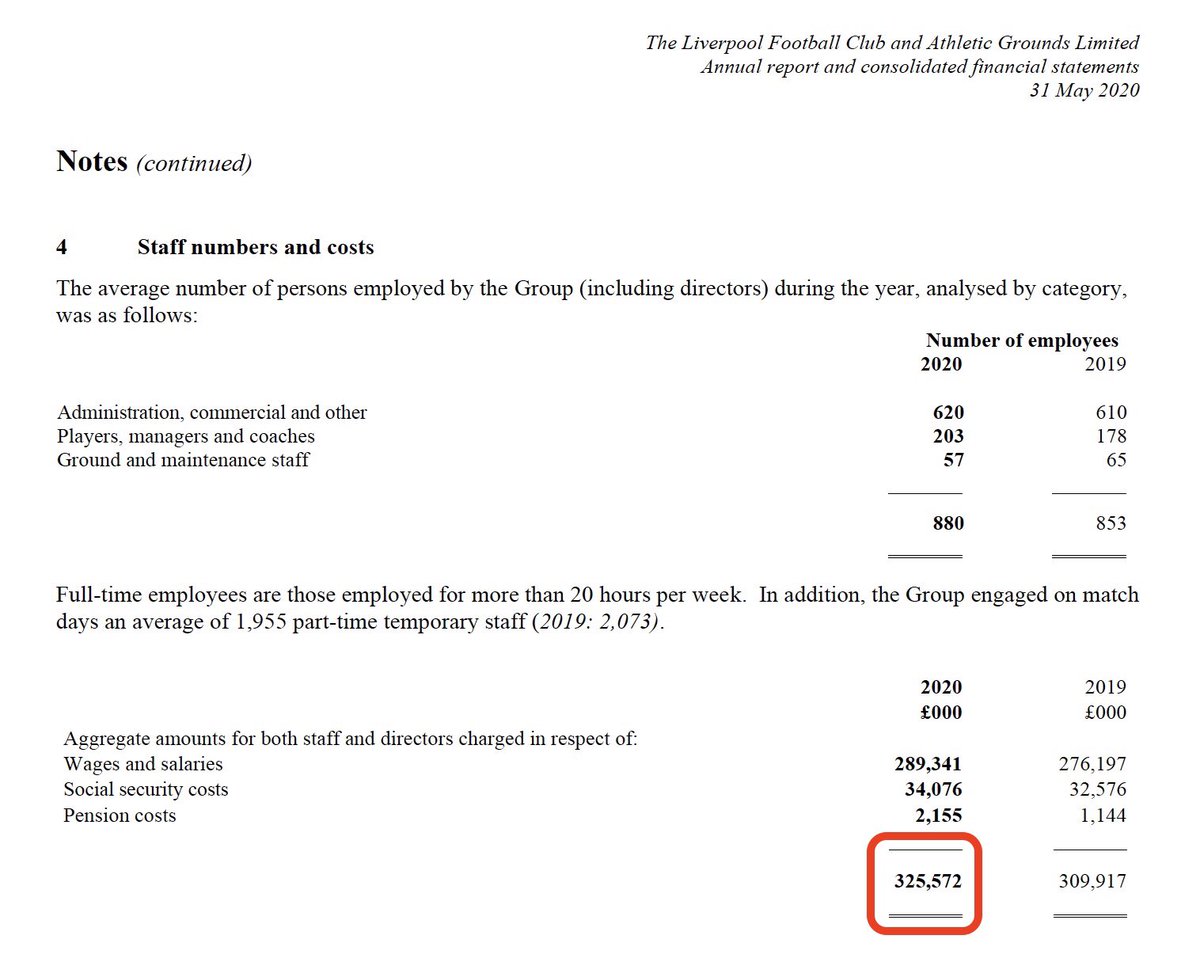
Per the club’s audited accounts, #LFC £326m wage bill, including all staff, is the second highest in England, only behind #MCFC £351m, but ahead of #MUFC £284m and #CFC £283m. This includes social security and highly incentivized bonus payments, i.e. it’s the price of success. 
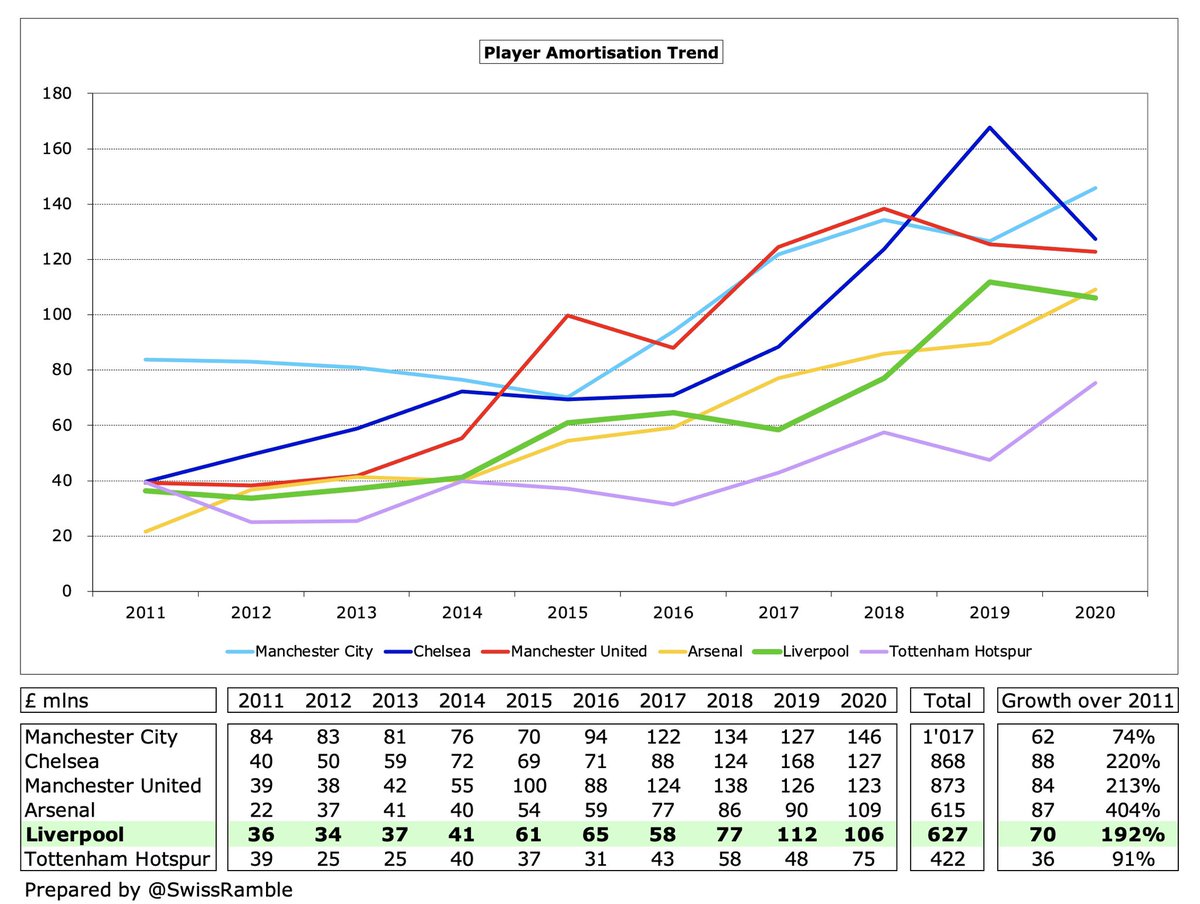
Similarly, #LFC player amortisation, the annual charge to expense transfer fees over a player’s contract, has almost tripled from £36m to £106m since 2011. This reflects investment in the team, but is still lower than #MCFC £146m, #CFC £127m, #MUFC £123m and #AFC £109m. 


The profit and loss account does not tell the whole story, as it only shows accounting profit, which is very different from actual cash movements. In last 10 years #LFC had £61m pre-tax profit (£260m operating loss), but £130m cash inflow after other expenditure and financing. 

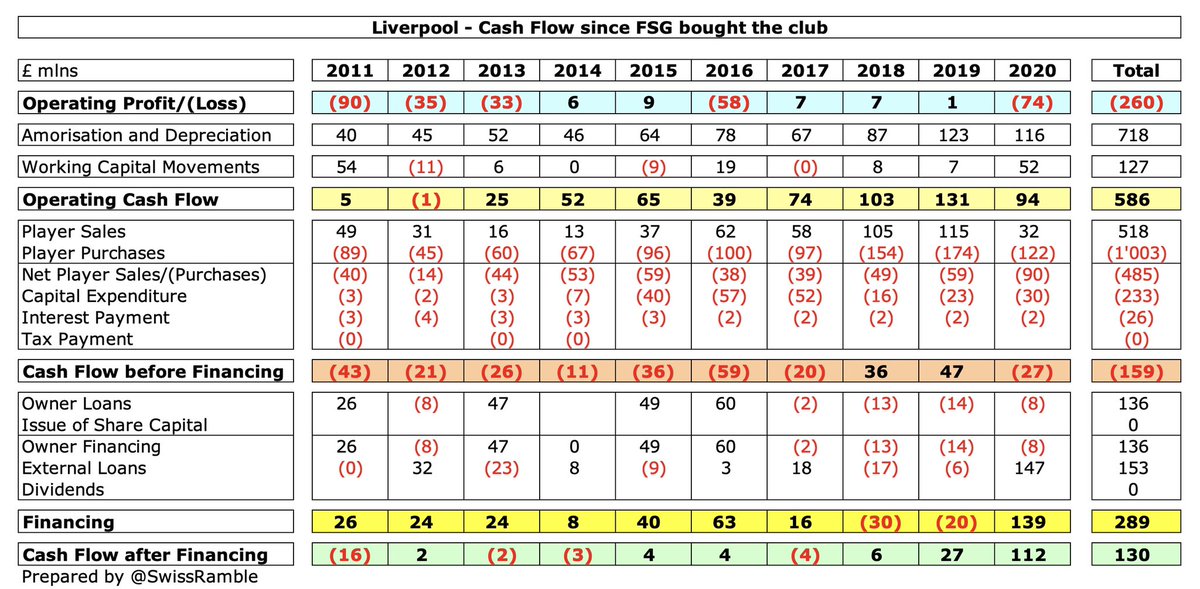
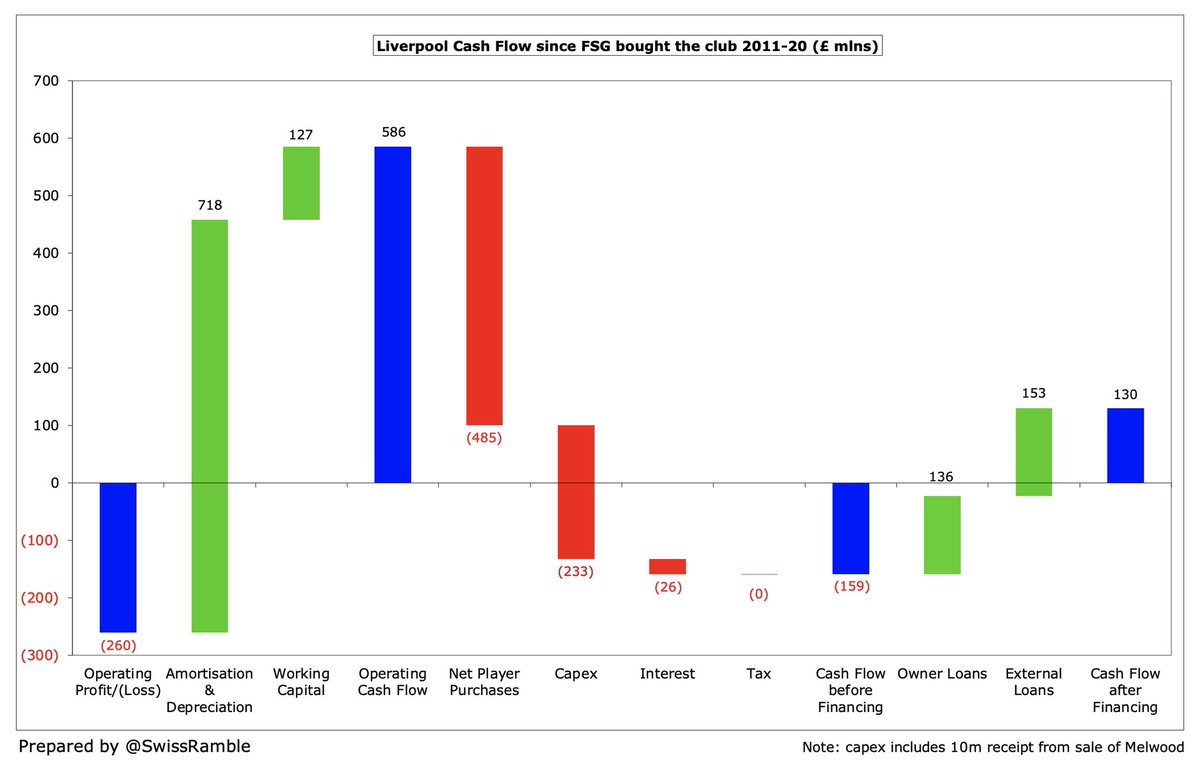
For the cash flow statement, we need to do 2 things: (1) first, strip out the non-cash accounting entries, both for player trading, namely profit on player sales and player amortisation, and other depreciation, impairment, etc; (2) then, adjust for working capital movements.
At this stage we should understand how football clubs account for player trading, both for purchases and sales, as the accounting treatment in the profit and loss account is completely different to the actual cash movements.
Football clubs do not fully expense transfer fees in the year a player is purchased, but instead write-off the cost evenly over the length of the player’s contract via player amortisation, while any profit made from selling players is immediately booked to the accounts.
So if a player is purchased for £30m on a 5-year contract, the annual amortisation in the accounts is £6m, i.e. £30m divided by 5 years. This means that the player’s book value reduces by £6m a year, so after 3 years his value in the accounts would be £12m, i.e. £30m less £18m. 

If the player were to be sold at this point for £35m, the profit on player sales from an accounting perspective would be £23m, i.e. sales proceeds of £35m less remaining book value of £12m. 

Player amortisation is a major expense in the profit and loss account. However, as we have seen, it is relatively low at #LFC, so over the last 10 years they only add back £718m (including depreciation) to operating profit, compared to around £1 bln at #MCFC, #CFC and #MUFC. 

Working capital measures short-term liquidity, defined as current assets less current liabilities. Changes in working capital can cause operating cash flow to differ from net profit, as clubs book revenue and expenses when they occur instead of when cash actually changes hands.
If current liabilities increase, a club is paying its suppliers more slowly, so is holding on to cash (positive for cash flow). On the other hand, if a club’s debtors increase, this means it collected less money from customers than it recorded as revenue (negative for cash flow).
Most clubs had favourable working capital movements, as they increased creditors, especially #THFC £340m. In the same way, #LFC had a £127m beneficial impact, while #CFC cash flow on the other hand was adversely impacted by a £61m negative movement (increase in debtors). 
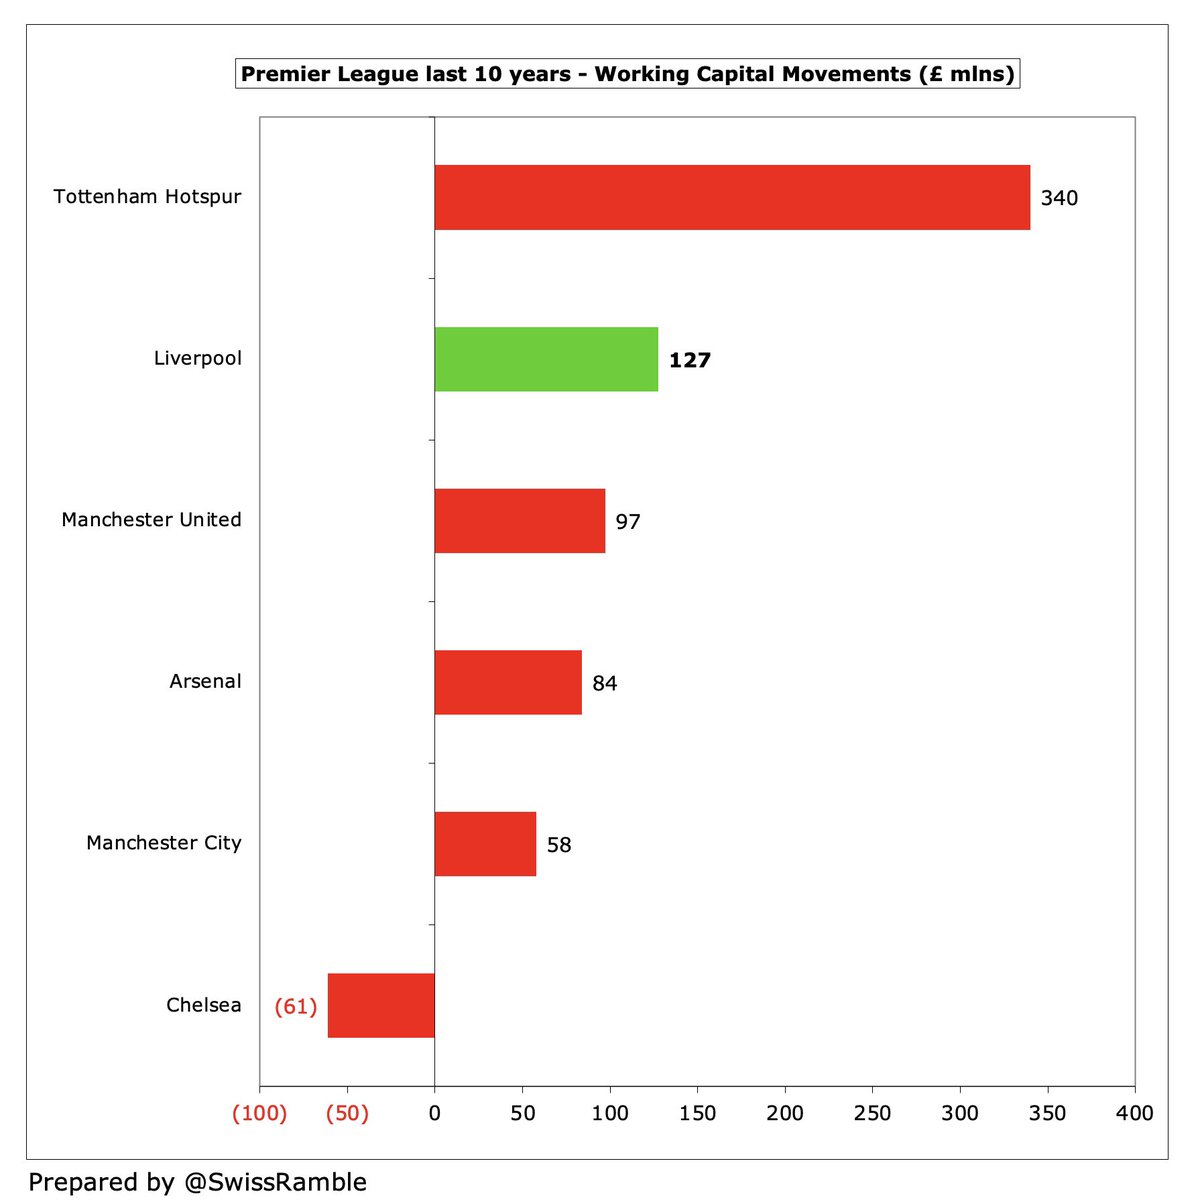
This is horribly technical, but important for #LFC, because, as a result of these adjustments to the profit and loss account, other clubs’ available cash has been boosted much more, e.g. #LFC £846m (amortisation/depreciation £718m, working capital £127m) against #MCFC £1,202m. 


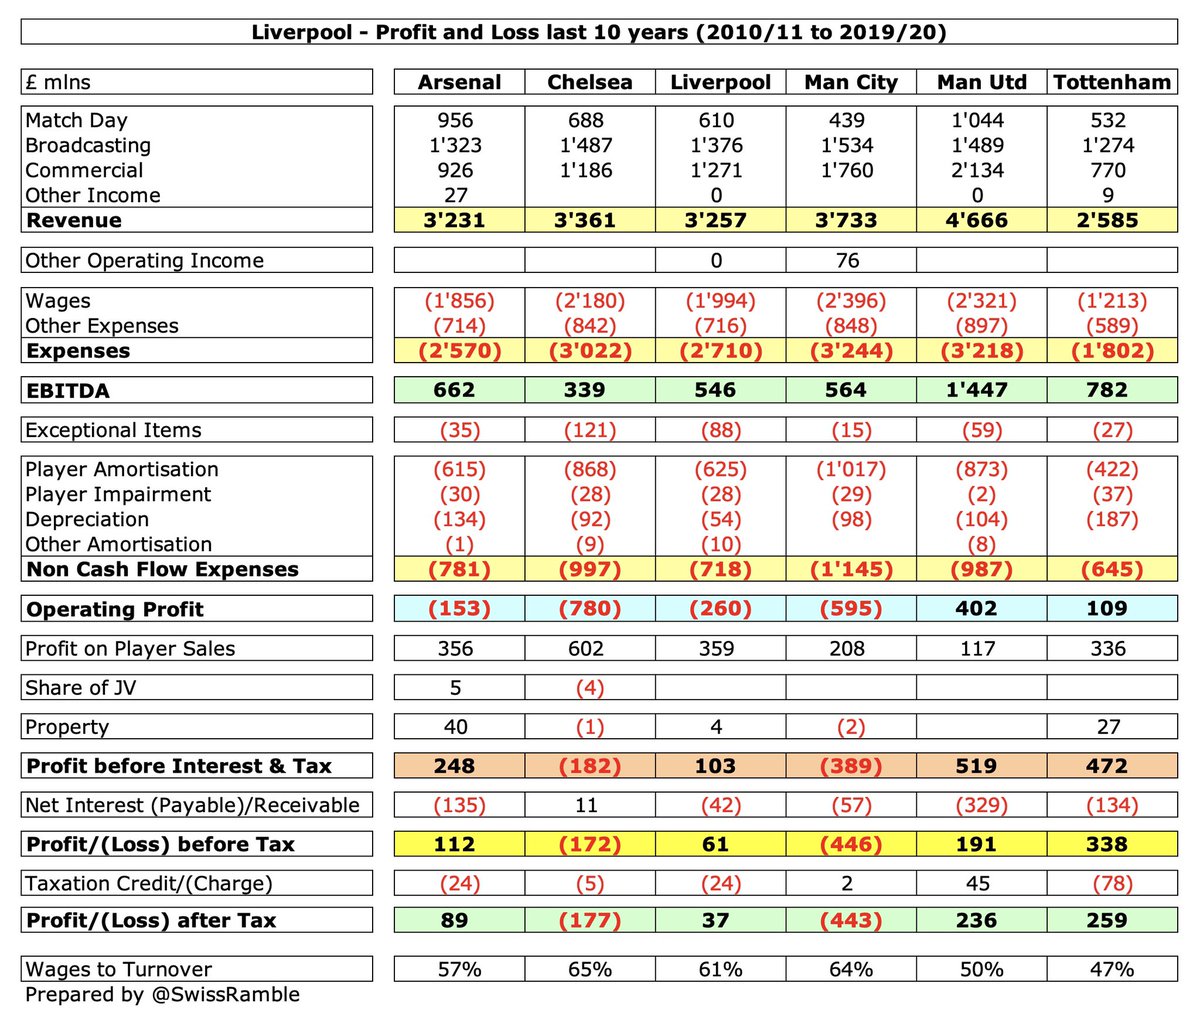
In this way, over the last 10 years #LFC £260m operating loss has been adjusted to give £586m operating cash flow, while #MCFC had a higher £607m operating cash flow, despite having a worse £595m operating loss. Others had even more: #MUFC £1,485m, #THFC £1,095m and #AFC £711m. 


This helps explain why #LFC had much less money available to spend on players than their rivals, despite decent reported profits. As a consequence, they only spent £485m cash (net) in last 10 years, around half of #MCFC and #MUFC, comprising £1,003m purchases less £518m sales. 


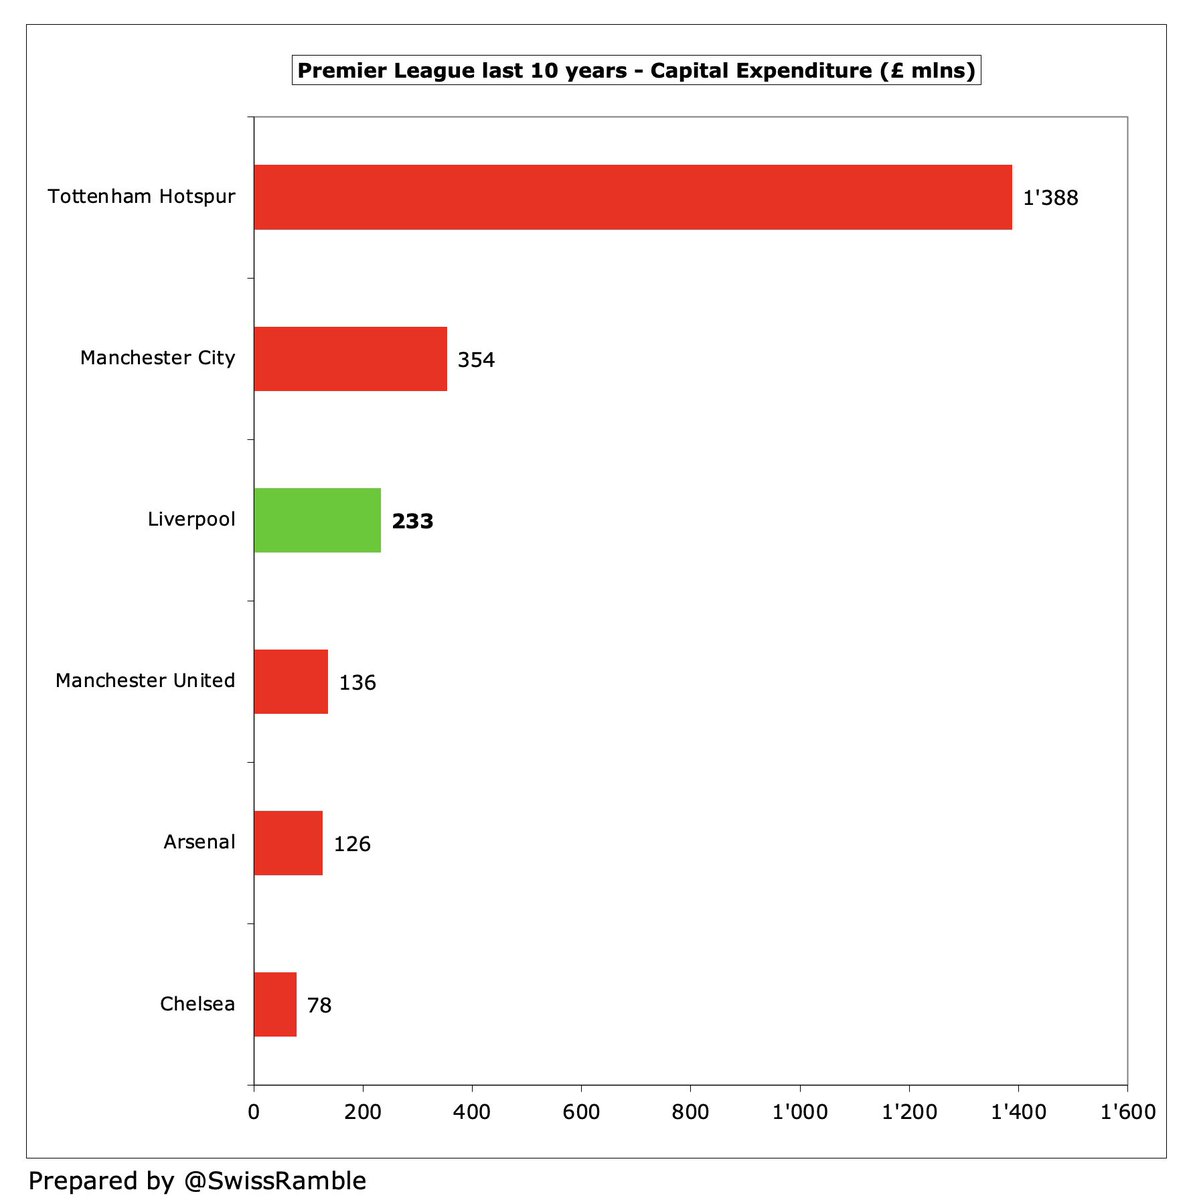
#LFC have also had £233m capital expenditure, including Main Stand development & Kirkby training ground, though dwarfed by #THFC £1.4 bln (mainly new stadium). Outlay only reflected in profit and loss account via depreciation. Another £60m needed for Anfield Road stand expansion. 
#LFC owner loan is interest-free, while bank loan is now 1.2%, so #LFC only paid £26m in the last 10 years. This is in stark contrast to #MUFC, where the Glazers’ leveraged buy-out has resulted in £448m net interest payments. United also the only club to pay dividends (£122m). 


Thanks to tax losses in previous years, #LFC has not had to pay any corporation tax in the last six seasons, compared to hefty payments at #THFC £56m, #AFC £28m and #MUFC £23m. 

FSG have put in £136m financing in the last 10 years, mainly going towards stadium development, though the last cash injection was in 2016 (with repayments since then). Much more owner funding at #MCFC £837m and #CFC £559m. #MUFC £297m is via share issue, not from the Glazers. 

#THFC increased their external debt by £746m (to finance the new stadium), while #LFC £153m is almost entirely due to taking out £147m secured bank loan in 2020. Other clubs have made loan repayments in last 10 years: #MUFC £249m, #AFC £76m and #MCFC £39m. 

After all these movements, #LFC had a net cash inflow of £130m over 10 years, the second highest of the Big Six. However, this is a little misleading, as it is largely due to the £147m increase in the bank loan in 2020. Excluding this, Liverpool would have had a cash outflow. 

This is reflected in #LFC cash balance as at May 2020 rising to £149m, though still lower than #THFC £226m (boosted by £175m COVID government loan). Cash balances will have been needed to cover shortfalls during the 2020/21 season, which was severely impacted by the pandemic. 


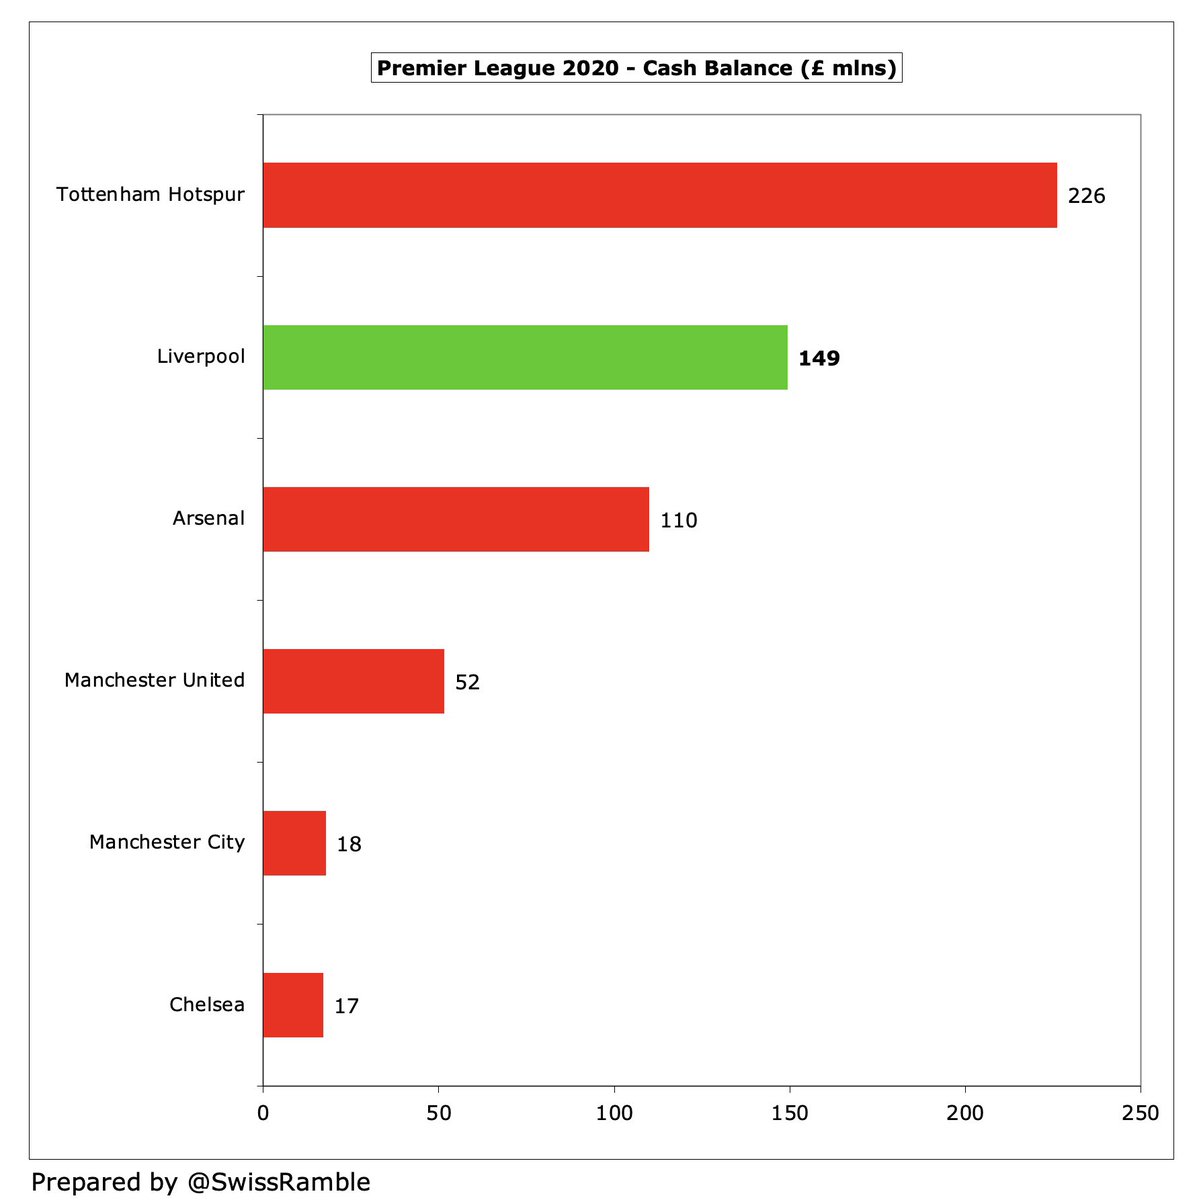
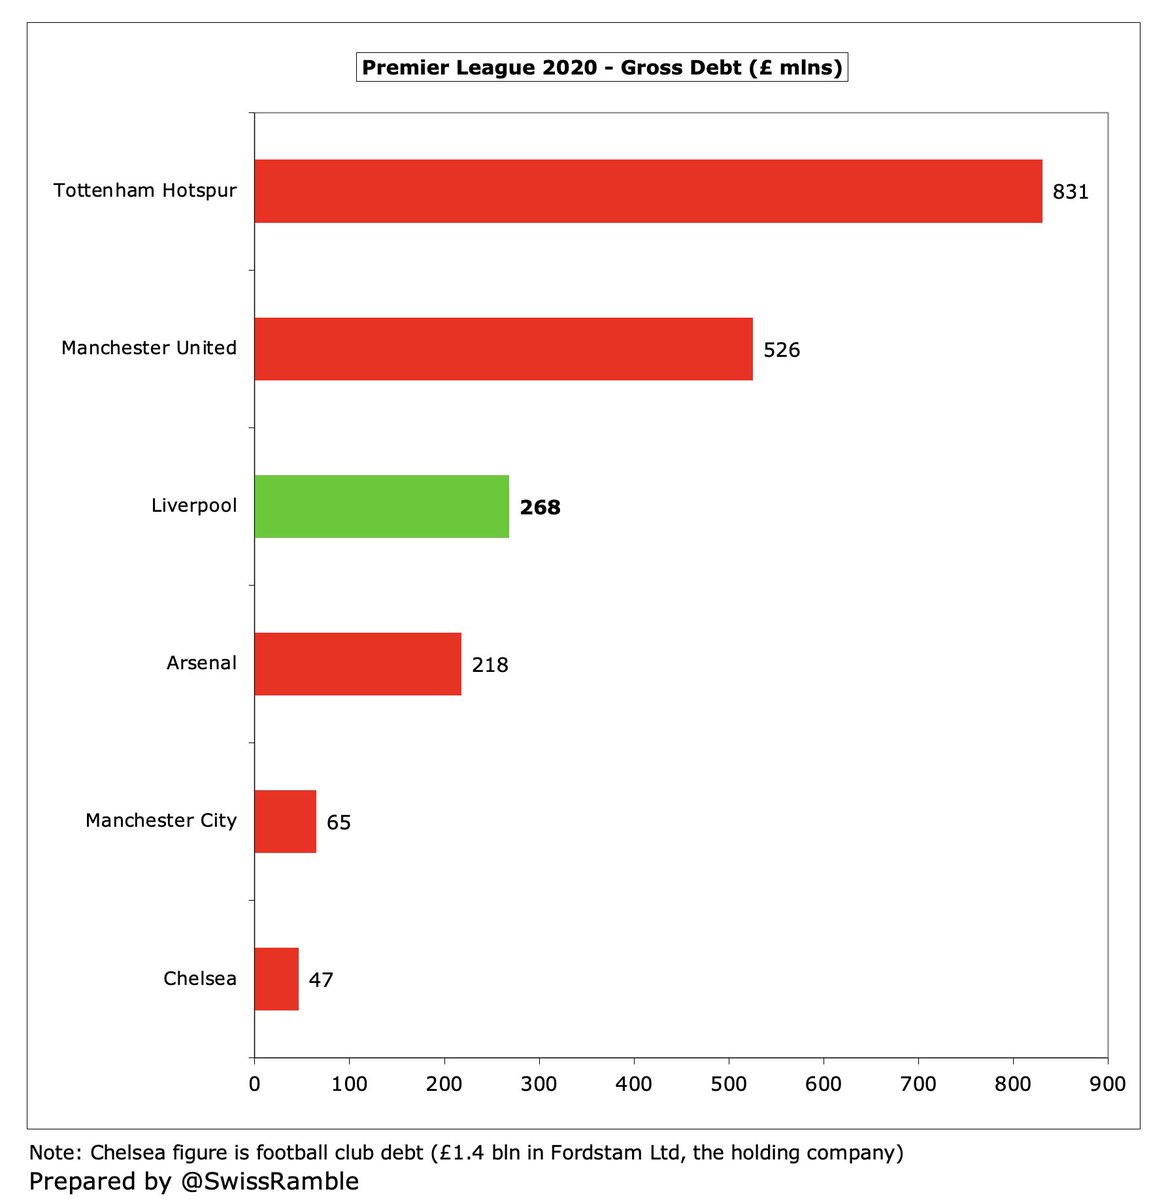
One way for clubs to finance transfers is to take on more debt. Few clubs in the Big Six have done this, though #LFC are actually up by £200m since 2011, while #THFC have increased debt to fund their new stadium. #MUFC growth is largely due to exchange rate movements on USD debt. 


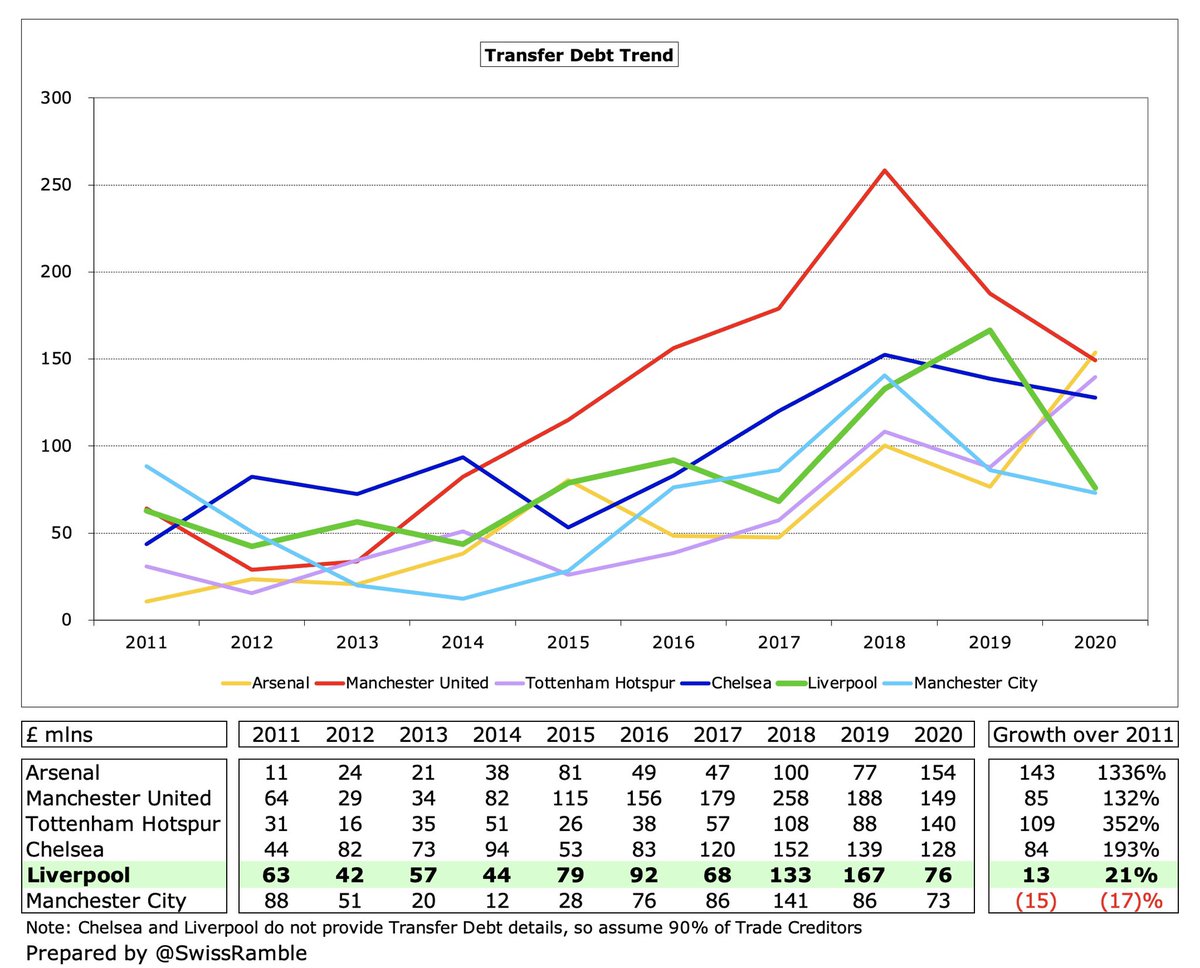
Another way to “fund” transfers is to pay in instalments, but #LFC seem less willing to go down this route. In fact, their transfer debt has only increased by £13m since 2011 to £76m, while the North London clubs have significantly grown: #AFC by £143m and #THFC by £109m. 



Like other clubs, #LFC have been hit hard by the impact of COVID. I reckon they lost £29m in 2019/20, due to games played behind closed doors £13m and broadcaster rebates £16m (£13m Premier League, £3m UEFA). Also £35m deferred to 2020/21 accounts, but only a timing difference. 


The COVID impact will have been much larger in 2020/21, as almost all games were played without fans. I have estimated £123m: (a) match day £80m (95% loss); (b) Premier League rebate £8m (per media reports); (c) Europe TV £3m (rebate); commercial £33m (15% decrease assumed). 

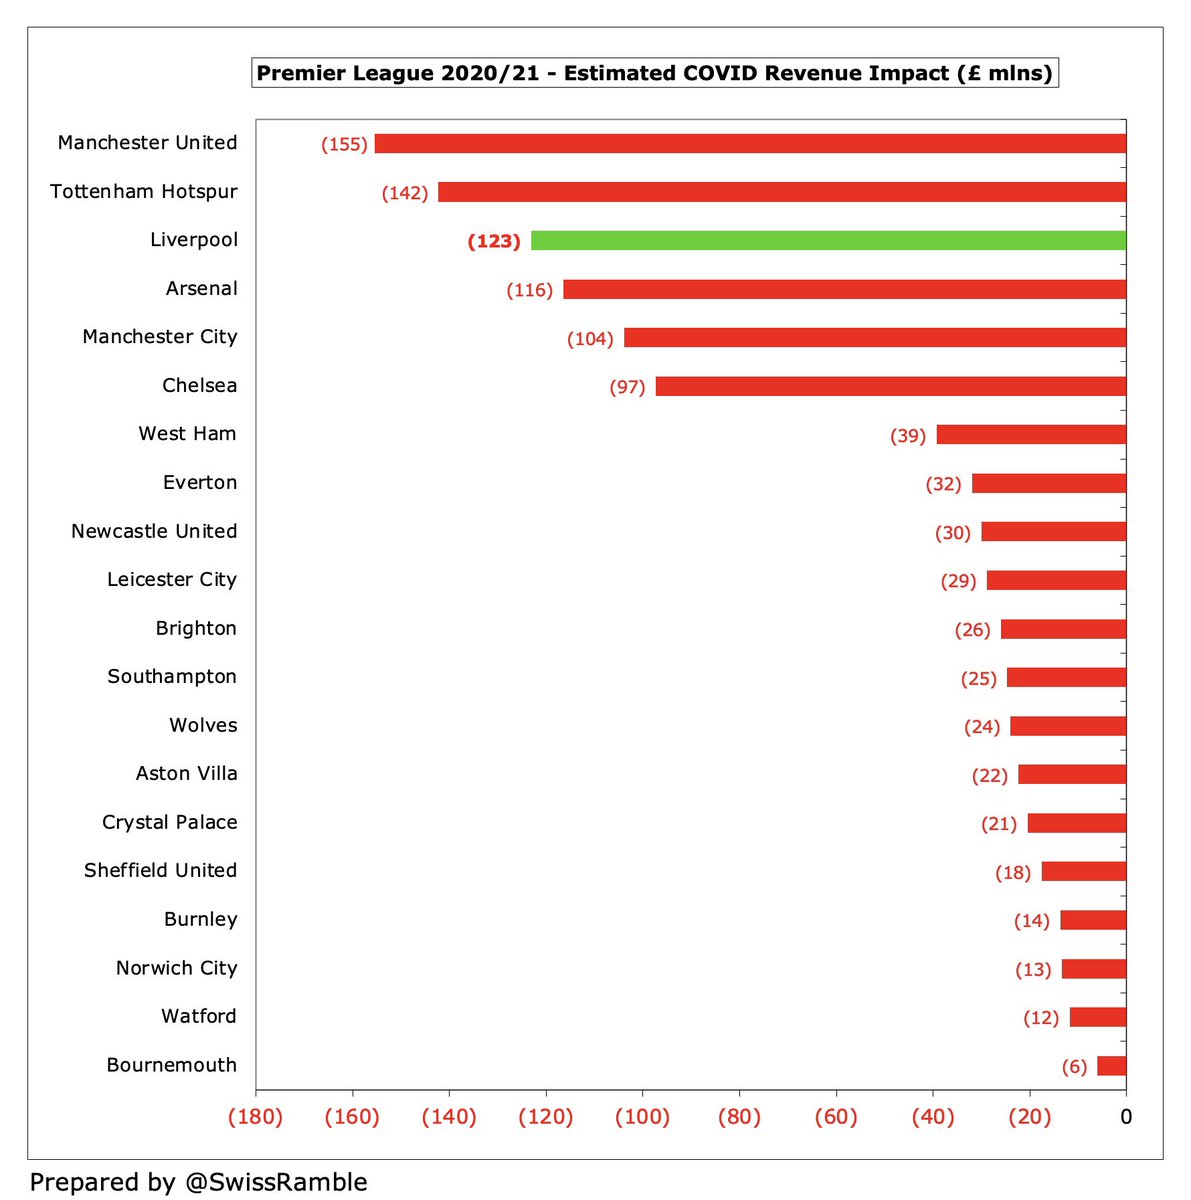

Based on these assumptions, #LFC will have lost £152m over the past 2 seasons (2019/20 £29m and 2020/21 £123m), split between match day £92m, broadcasting £27m & commercial £33m. These figures are only indicative, but for sure the club has missed out on a lot of money. 

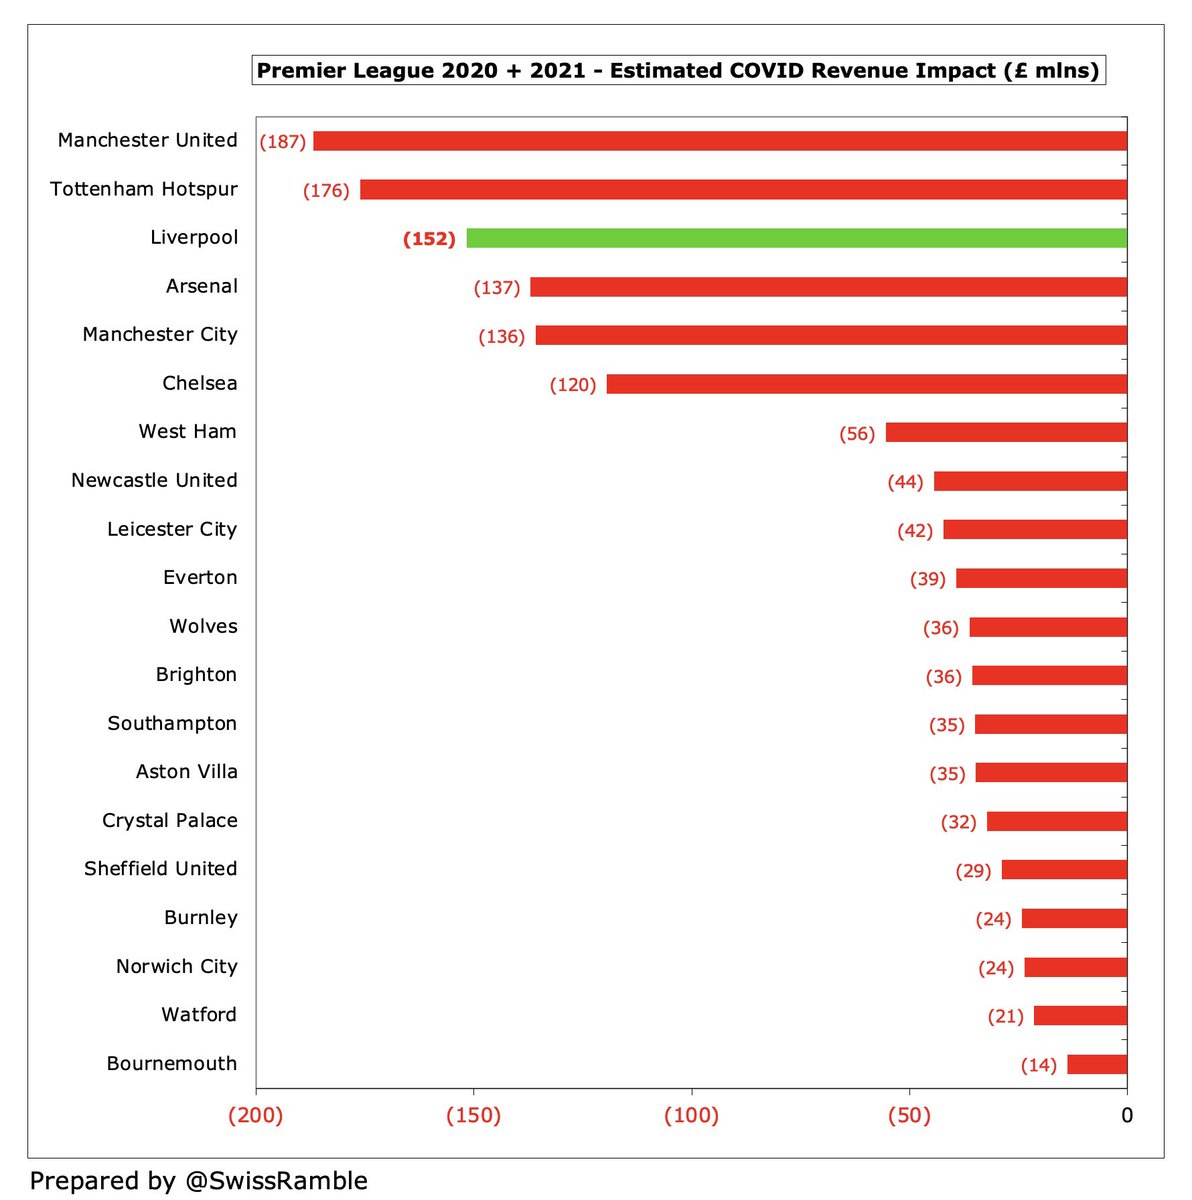

FSG have sold 10% of their company to Red Bird Capital, which should help strengthen the #LFC balance sheet, cover COVID losses and help fund the Anfield expansion. Although this might facilitate some transfer spending, it is unlikely to go towards a massive “war chest”.
It is understandable that #LFC fans would want their club to strengthen, but Jürgen Klopp acknowledged their challenge, “We all know the situation at Chelsea, City and PSG. Obviously, they have no limits. We are allowed to spend the money that we earn. That’s what we always did.”
#LFC could invest more money in the transfer market, but this would mean them changing their sustainable business model. They have always tried to “sell to buy”, but this has proved difficult in the current environment, as the usual purchasers are suffering financially.
Low spending is a calculated risk, as #LFC might be overtaken by others in the race for the Champions League (and its lucrative rewards), especially as the team is growing old together, but as Klopp said, “we were quite successful given the limits in the last two years.”
• • •
Missing some Tweet in this thread? You can try to
force a refresh


