“Knowledge is power, but it is much more powerful when it is shared.”
As part of @Wikimedia's @Wikipedia #WikipediaByUs campaign we celebrate access to knowledge.
Why is knowledge sharing important especially in a time of a pandemic? How can we counter misinformation? Thread 🧵
As part of @Wikimedia's @Wikipedia #WikipediaByUs campaign we celebrate access to knowledge.
Why is knowledge sharing important especially in a time of a pandemic? How can we counter misinformation? Thread 🧵
Early on in the #COVID19 pandemic there was much fear, uncertainty, and misinformation. There still is!
As we gather more data, new research, more knowledge, our understanding improves and we can counter those uncertainties.
But that knowledge needs to be accessible too...
As we gather more data, new research, more knowledge, our understanding improves and we can counter those uncertainties.
But that knowledge needs to be accessible too...
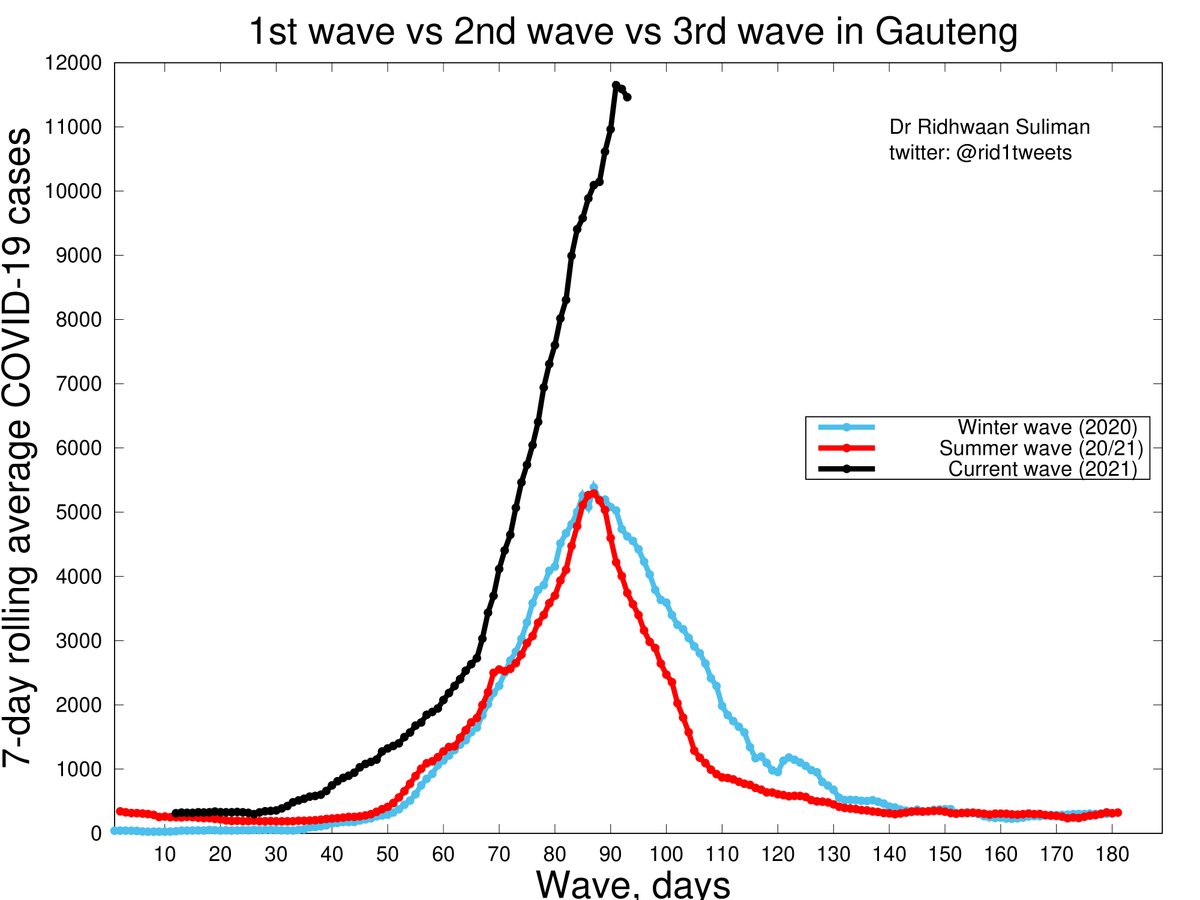
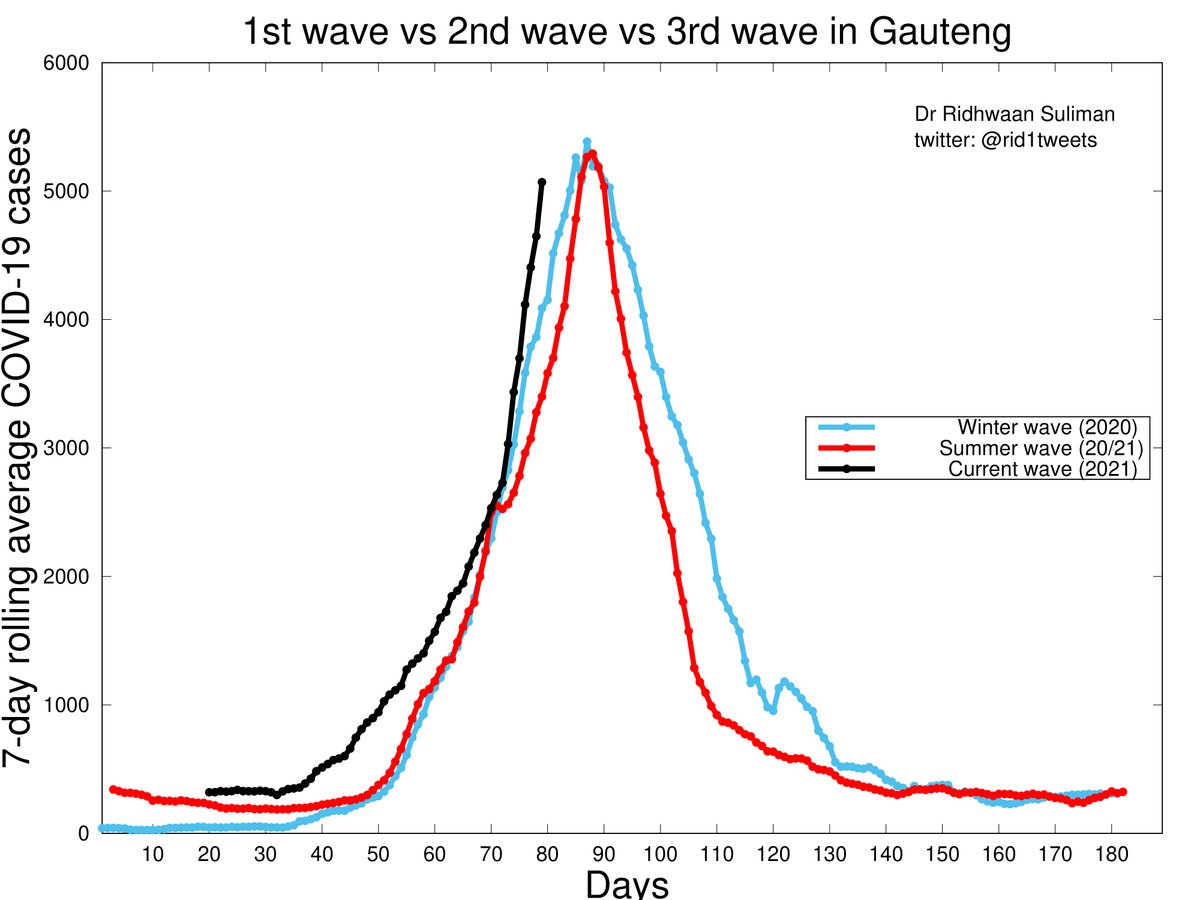
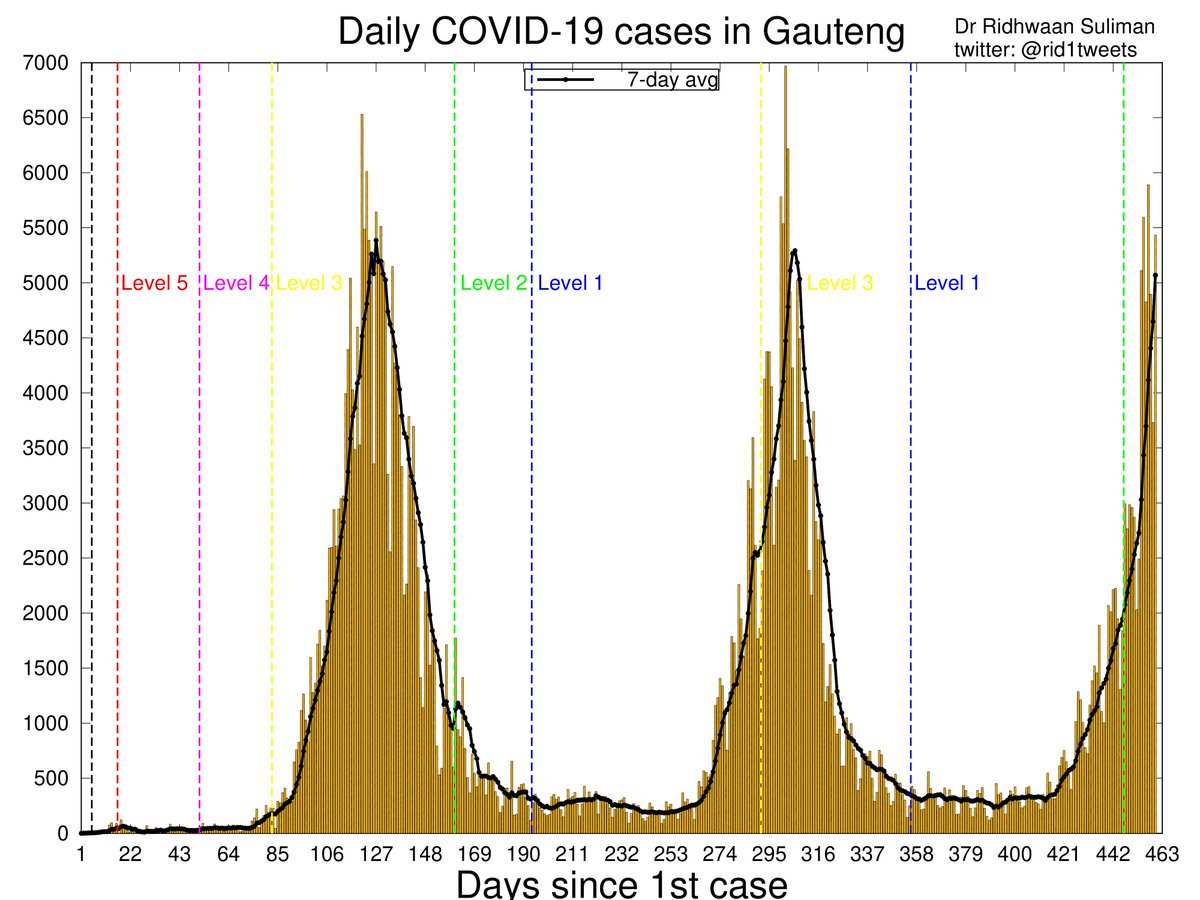
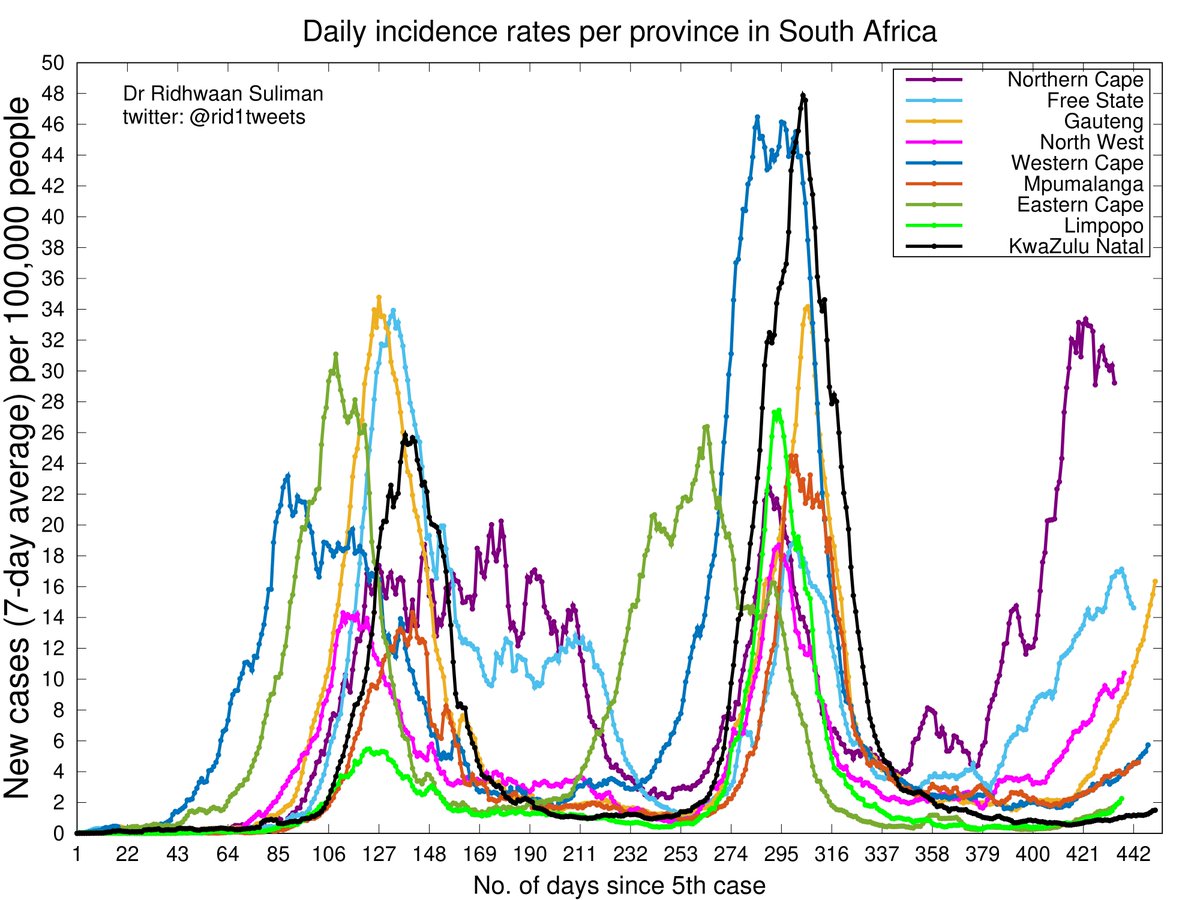
Numbers and statistics can be overwhelming, and so needs to also be shared in a way that's simple, clear and understandable
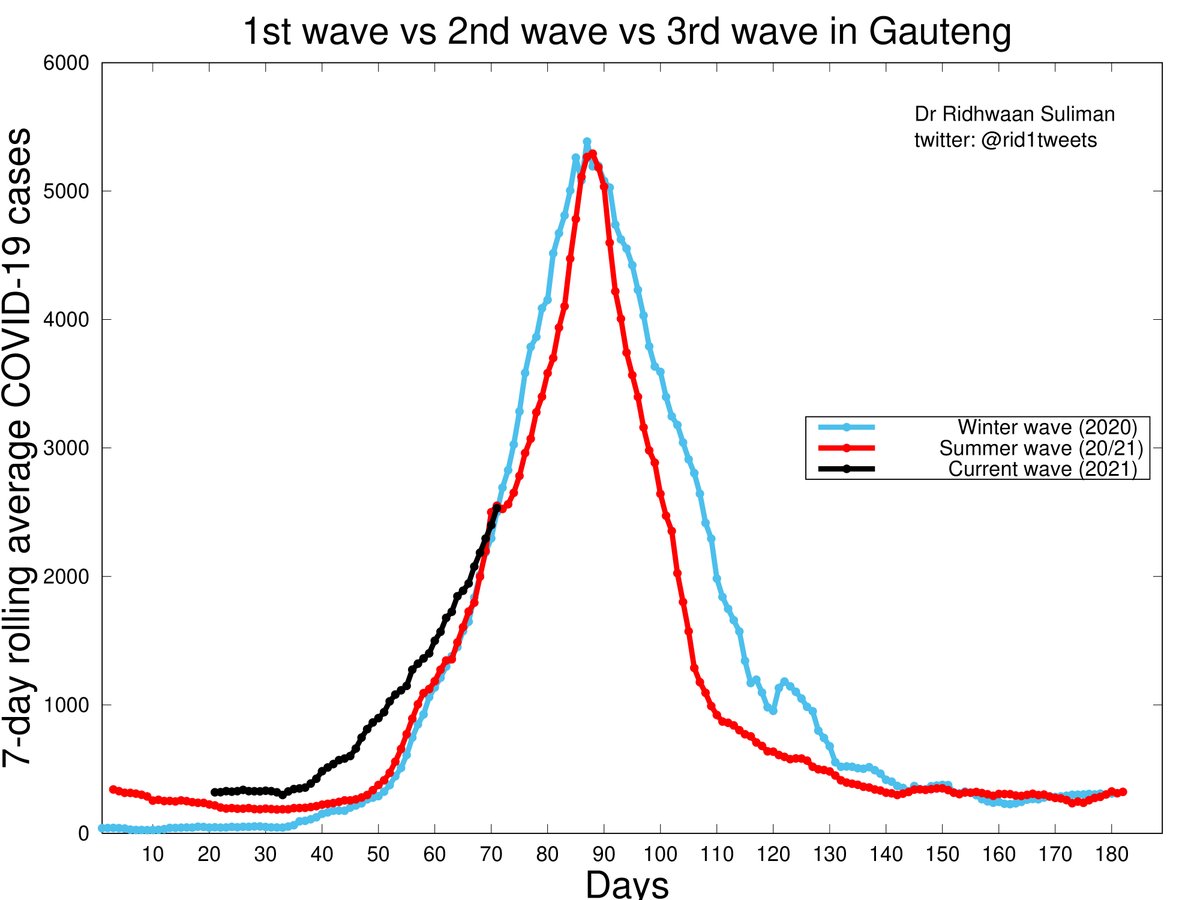
Just like a picture can tell a thousand words, graphs can put numbers and quantities into perspective, show trends, and tell a better story
#WikipediaByUs
Just like a picture can tell a thousand words, graphs can put numbers and quantities into perspective, show trends, and tell a better story
#WikipediaByUs

A doorway to knowledge is a basic human right and access to knowledge should be made available to all.
Here's a piece of knowledge sourced from Wikipedia that speaks to information access. Read more here: en.wikipedia.org/wiki/Informati…
#WikipediaByUs @Wikipedia @bubblegumclubbb

Here's a piece of knowledge sourced from Wikipedia that speaks to information access. Read more here: en.wikipedia.org/wiki/Informati…
#WikipediaByUs @Wikipedia @bubblegumclubbb


Data can be a powerful tool to combat misinformation.
Data has limitations and nuances, but lack of access to or only cherry-picking certain sets of data can stir misinformation.
#knowledge #data #misinformation #WikipediaByUs
Data has limitations and nuances, but lack of access to or only cherry-picking certain sets of data can stir misinformation.
#knowledge #data #misinformation #WikipediaByUs

Deliberately spreading fake news and other misinformation in South Africa about the virus was declared an offence punishable by a fine, six months' imprisonment, or both.
Read more here:
en.wikipedia.org/wiki/COVID-19_…
and here:
en.wikipedia.org/wiki/COVID-19_…
@Wikipedia #WikipediaByUs
Read more here:
en.wikipedia.org/wiki/COVID-19_…
and here:
en.wikipedia.org/wiki/COVID-19_…
@Wikipedia #WikipediaByUs
Did you know: Individual traits and qualities such as age, working memory capacity, personality traits, and imagery abilities can either increase or decrease one's susceptibility to recalling misinformation:
en.wikipedia.org/wiki/Misinform…
#WikipediaByUs @Wikipedia @bubblegumclubbb

en.wikipedia.org/wiki/Misinform…
#WikipediaByUs @Wikipedia @bubblegumclubbb


In this digital era, knowledge that is open and obtainable empowers people, boosts productivity, builds a sense of community, and also affords creativity
#knowledge #access #creativity #WikipediaByUs
#knowledge #access #creativity #WikipediaByUs

Creativity allows me to utilise South Africa's COVID-19 data and information and visually portray the numbers in an uncomplicated way. In a way that tells a story. In a way that is easily understood by just about anybody
Access to knowledge and data allows me to turn the numbers into simple and clear graphics that put the numbers in perspective and understand the overall situation.
Sharing this information on twitter makes it easily accessible to the general public.
#knowledge #WikipediaByUs
Sharing this information on twitter makes it easily accessible to the general public.
#knowledge #WikipediaByUs
• • •
Missing some Tweet in this thread? You can try to
force a refresh


