After I put together a thread looking at the financial trends in the Premier League over the last 10 years from 2011 to 2020, a few people asked me if I could do the same for the EFL Championship. So here are the finances for England’s second tier over the last decade.
This analysis comes with caveats, as not all Championship clubs published accounts in the last decade, e.g. Derby County in 2019 and 2020. Also no accounts for clubs in administration, e.g. Portsmouth (2011 & 2012), Bolton Wanderers (2018 & 2019) and Wigan Athletic (2020).
Nevertheless, the themes and trends can still be highlighted, including the impact of COVID in the last three months of 2020. We will also feature some comparisons with the Premier League to illustrate the immense differences between England’s top two divisions.
Championship loss before tax widened in 2020 from £238m to £449m, as the initial effect of the pandemic began to bite. However, it is clear that this division bleeds money in any case with total losses of £2.5 bln in the last decade, including £1.4 bln in last 5 years alone. 

The situation in the Championship is much the same after tax, though the 2020 loss was smaller at £435m, because of £14m tax credits. Due to the accounting losses, most years produce tax credits.


It is worth noting that both 2018 and 2019 figures benefited from property sales (stadiums or training grounds), mainly to other group companies, as a device to help meet FFP targets: 2019 £113m, largely at #SWFC, #AVFC, #BCFC and Brentford; 2018 £55m was mainly #DCFC.

Similarly, the Championship bottom line also impacted by exceptional items, which can go either way. For example, 2014 was boosted by £43m, mainly QPR £60m loan write-off. In contrast, 2019 hit by £29m charges, mainly #AVFC promotion liabilities.

Championship EBITDA (Earnings Before Interest, Depreciation and Amortisation), which strips out player sales, non-cash items and interest to give underlying profitability, has been consistently negative, but dropped from £287m to £351m in 2020, the worst ever result.

At an operating level, i.e. including player amortisation and depreciation, but excluding player sales and interest, the situation is even worse. Championship operating losses have been steadily widening, increasing from £203m in 2011 to £689m in 2020.

This emphasises the importance of profit from player sales to mitigate operating losses, but this has seemingly reached a plateau in the Championship. Having nearly doubled in 2017 from £123m to £222m, profit from player trading has only grown to £260m in the 3 years since.

In 2019/20 Championship £449m pre-tax loss was less than half of Premier League £992m, as COVID had a larger financial impact in #PL. Operating loss of £689m also much lower than PL £1.4 bln, though PL £542m player sales twice as much as Championship £260m.

However, the picture is different in a more normal year in 2019 (i.e. pre-pandemic), when Championship losses were higher than PL: pre-tax £238m vs £155m; operating £558m vs £490m. Player sales profits also lower £250m vs £434m. Partly offset by £113m profit from stadium sales.

Same story over last decade, i.e. Championship pre-tax losses much higher £2.5 bln vs £721m. Both leagues have big operating losses £3.9 bln vs £3.7 bln, but PL boosted by much higher player sales profits £3.8 bln vs £1.4 bln. However, interest payable more in PL £929n vs £173m.

Championship revenue shot up from £547m to £718m in 2017 (new TV deals), but has been relatively flat since then. Fell £103m (14%) in 2020 from £736m to £633m, partly due to impact of COVID in last few months, but also because two clubs (#DCFC & #WAFC) did not publish accounts.

Championship match day income fell £32m (24%) in 2020 from £137m to £105m, down from £161m peak in 2017 (included #NUFC, #AVFC and #LUFC), as COVID meant clubs played 4-6 games behind closed doors. Revenue will be very low in 2021, as virtually all games played without fans.

Broadcasting revenue has driven Championship revenue growth, rising by more than £200m from £168m in 2011 to £407m in 2019, but dropped £37m (9%) to £370m in 2020, due to broadcaster rebates and revenue deferred to 2020/21 accounts for games played after 2019/20 accounting close.

Much of the growth in Championship TV money is due to higher Premier League parachute payments, up from £60m in 2011 to £228m in 2020, largely coinciding with new deals in 2014 and 2017. Would be even higher if included payments to clubs relegated to League One, e.g. #SAFC.

Also good growth in commercial revenue in the Championship, which nearly doubled from £100m in 2011 to £184m in 2019, before dropping back £27m (15%) to £157m in 2020. Likely to fall further in 2021, as commercial partners had less exposure and division lost promoted #LUFC £34m.

Over the last decade the revenue mix at Championship clubs has significantly changed. Taking 2019 as a more normal season, match day reduced from 32% to 19%, while broadcasting increased from 43% to 56%, though commercial was flat at 25%. 2020 is distorted by the pandemic.

2019/20 revenue comparisons show a huge difference between the Premier League and Championship: total revenue £4.5 bln vs £633m; broadcasting £2.3 bln vs £370m; commercial £1.6 bln vs £157m; and match day £588m vs £105m.

In the more normal 2018/19, i.e. pre-pandemic, the difference between the Premier League and Championship is even more stark: total revenue £5.2 bln is 7 times as much as £736m; broadcasting £3.0 bln vs £407m; commercial £1.4 bln vs £184m; and match day £681m vs £137m.

Over the 10 years 2011-20 the magnitude of the revenue difference between the Premier League and Championship is staggering: total revenue £36.4 bln vs £5.6 bln; broadcasting £20.0 bln vs £2.9 bln; commercial £10.3 bln vs £1.4 bln; and match day £6.0 bln vs £1.3 bln.

Championship wages fell £28m (4%) in 2020 from £762m to £734m, though have still more than doubled from £365m in 2011 (and up nearly £200m from £543m in 2016). Worth noting that 2002 also excludes wages from #DCFC and #WAFC, as no accounts published.
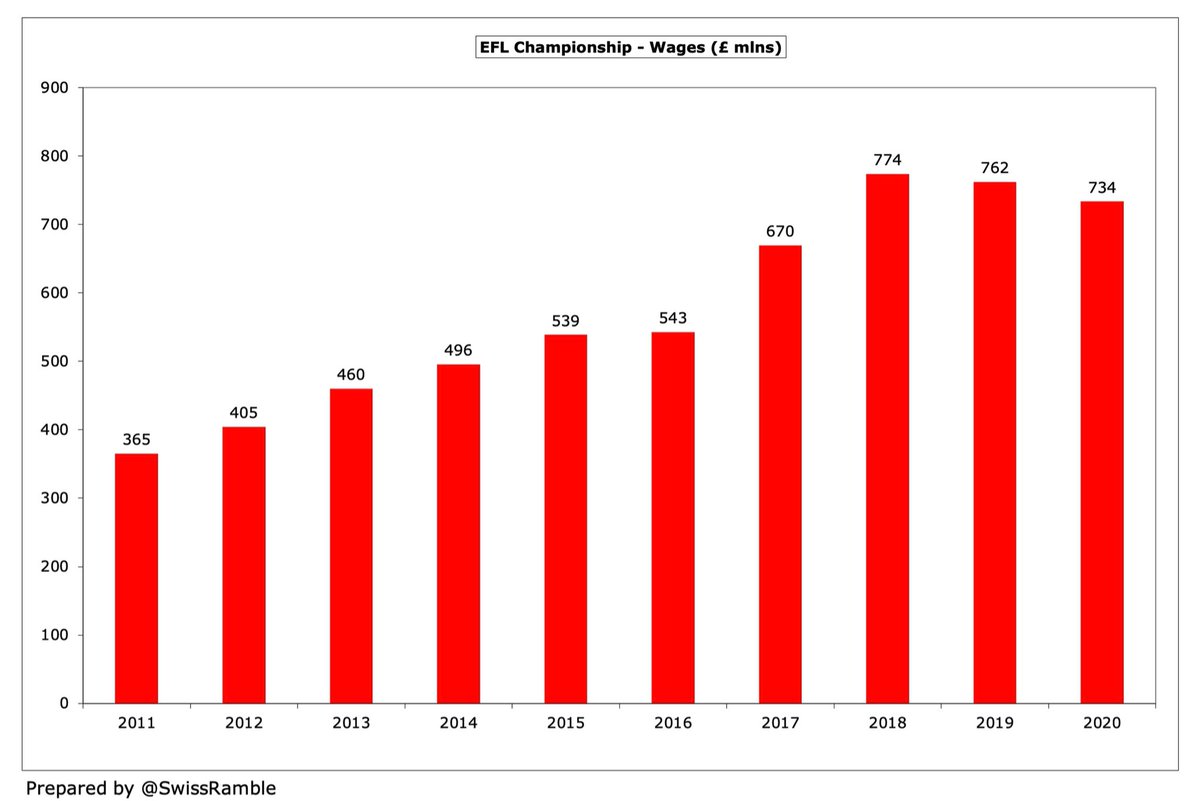
Since 2013 the Championship wages to turnover ratio has been consistently above 100% with the lowest in this period being 93% in 2017. Increased from 104% to 116% in 2020, due to the revenue reduction arising from COVID.

Championship player amortisation, the annual charge to write-off transfer fees over the contract, has also grown significantly from £67m in 2014 to £250m, including £17m (7%) increase in 2020. High player investment means this expense has more than doubled since 2016 from £107m.

Combining wages and player amortisation highlights how these costs have increased in the Championship, rising from £427m in 2011 to around £1 bln in 2020. In fact, £335m of that £557m growth has come in the last 4 years alone. Basically flat in 2020, despite the revenue fall.
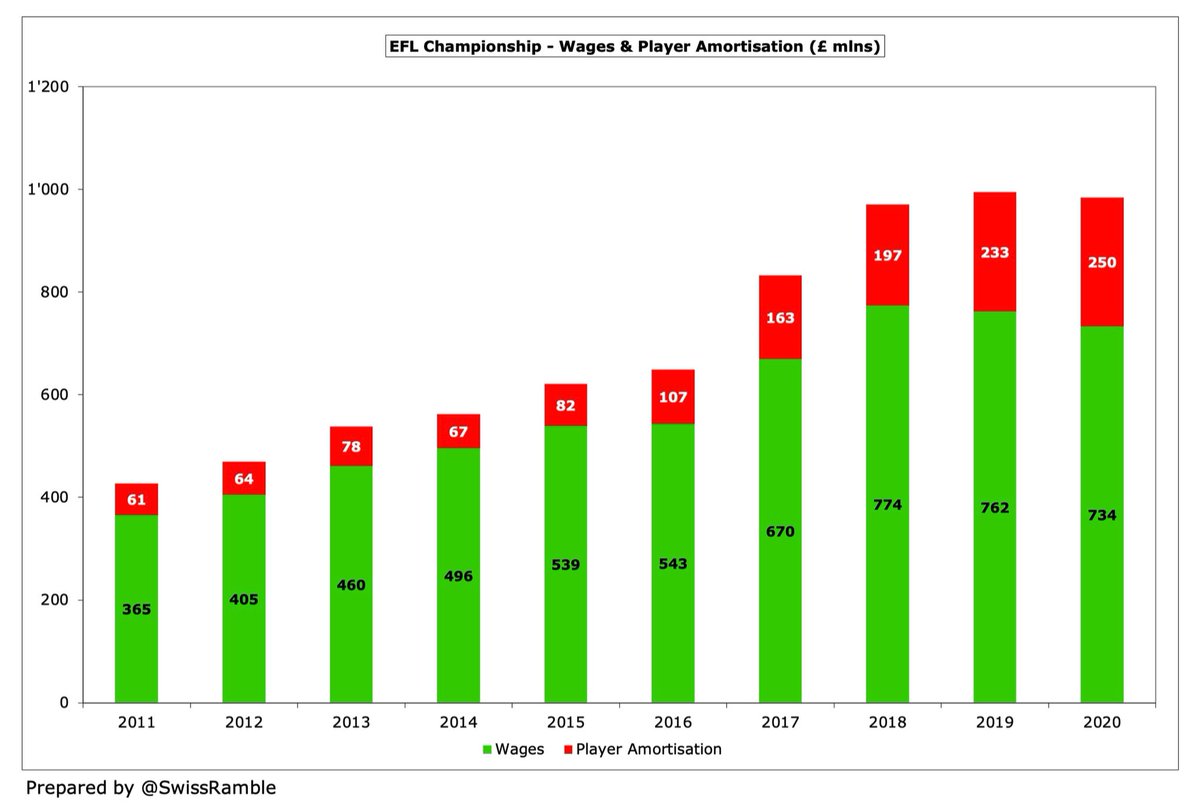
As a result, the Championship ratio of wages and player amortisation over turnover was as high as 155% in 2020, which means that clubs were already losing a lot of money before paying other expenses and interest. Even before the pandemic, this metrics was over 130%.

Championship other expenses, effectively the clubs’ running costs, steadily increased from £148m in 2011 to £260m in 2017, but have been more or less at the same level since then. These should fall in 2021, as there were lower costs incurred for staging matches.

Championship depreciation has decreased from £35m in 2017 to £29m in 2020, mainly due to #BHAFC being promoted (high depreciation after investment in stadium and training ground). The highest charges in 2020 were #Boro £3.1m, Bristol City £2.8m and #CAFC £2.8m.

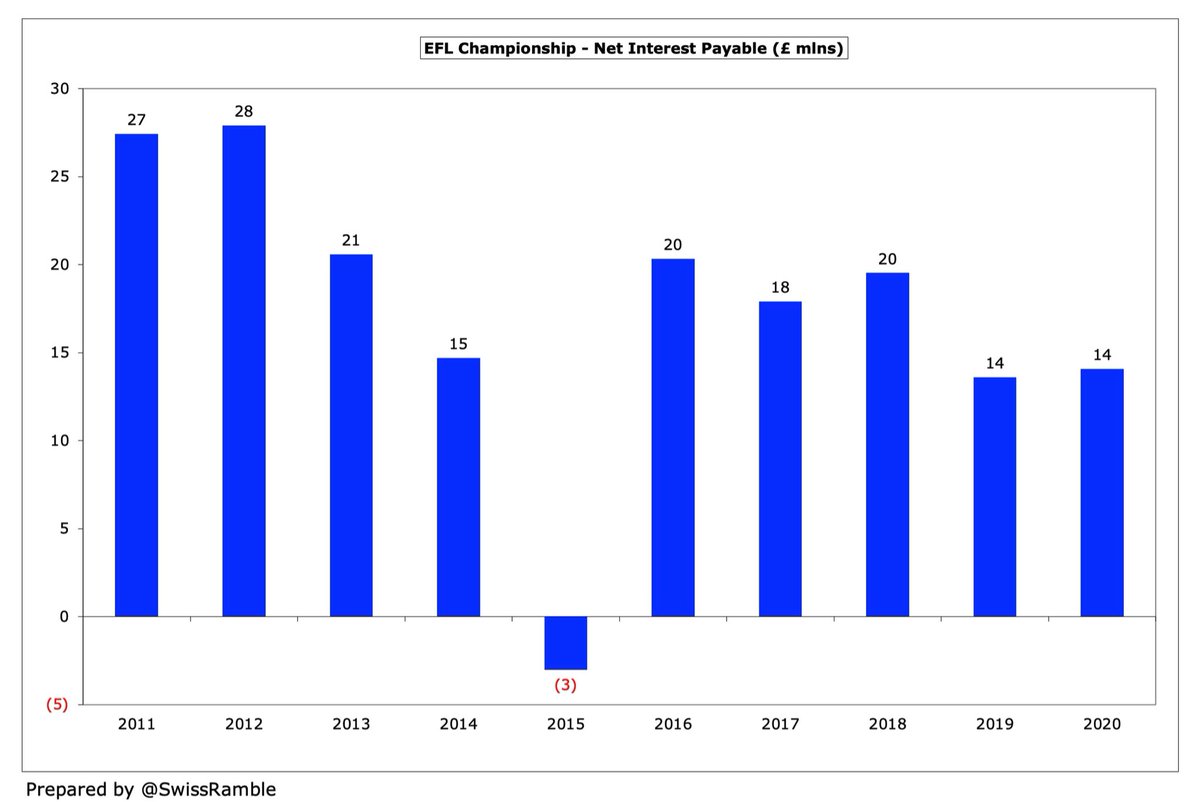
Championship net interest payable is also very low, as most debt is provided interest-free by owners. Only two clubs above £2m in 2020: #HTAFC £3.6m and Cardiff City £2.1m. Note: this does not necessarily mean this interest was paid, as might be only non-cash accounting entries.
As with revenue, Championship expenses are much lower than the Premier League. For example, in 2019/20: wages £734m vs £3.2 bln; player amortisation £250m vs £1.4 bln; depreciation £29m vs £182m; and other expenses £271m vs £1.0 bln.

Over the last 10 years, the expenses gap between Championship and Premier League is obviously magnified: wages £5.7 bln are a quarter of £22.8 bln; player amortisation £1.3 bln vs £7.9 bln; depreciation £267m vs £970m; and other expenses £2.1 bln vs £7.5 bln.

Championship gross debt has risen by £383m (41%) from £939m in 2018 to £1.3 bln in 2020, though this is still not as high as the £1.4 bln in 2016, a season that featured particularly large debt at #BWFC, #BHAFC and #BRFC. Highest debt in 2020 was Stoke City £187m.

The vast majority of debt in the Championship is via loans from club owners. This “soft” debt is up from £838m in 2018 to £1.2 bln in 2020, accounting for around 90% of total debt. Owner debt over £100m in 2020: Stoke City £187m, #BRFC £141m, #Boro £116m and #BCFC £116m.

Only £114m of Championship debt in 2020 is from external loans. In fact, this has nearly halved from £208m in 2011. Only 4 clubs were over £10m in 2020: Cardiff City £43m, #HTAFC £24m, #BRFC £15m and Brentford £15m.

However, Championship debt would have been £1.4 bln higher if owners had not converted loans to equity (£1.2 bln in last 10 years) or written-off amounts owed to them (£173m). Fulham alone converted £240m of their loans into share capital in this period.

As a rule, Championship clubs usually hold small cash balances, though this increased from £77m to £130m in 2020. The highest balance was #LUFC £32m, partly due to receiving the first tranche of Premier League TV money in advance (accounts extended to end-July).

However, Championship transfer debt, i.e. stage payments on transfer fees, has grown from just £55m in 2014 to £262m in 2020. Transfer receivables are also up in this period, but they have dropped since 2018 from £200m to £162m, so £100m net debt in 2020 is the highest ever.

Not only is debt significantly higher in Premier League than Championship (financial £3.7 bln vs £1.3 bln, transfer £2.6 bln vs £262m), but much more is external debt (£2.2 bln vs £114m). Championship owners also provided more debt relief (£1.4 bln vs £1.0 bln in last 10 years).

Championship gross transfer spend actually increased from £247m to £297m in 2020, though this is lower than the £351m peak in 2017. That said, it is still around 5 times as much as £61m outlay in 2011.

Championship player sales have been just over £300m for each of the last 4 years, so a total of £1.2 bln in this period. Recent annual sales are twice as much as the £152m made in 2016, which had been the highest sales up to that point.

Basically, Championship clubs spend what they make in the transfer market. In the last 10 years, the net transfer spend is just £36m, i.e. more or less break-even. The largest annual net spend in this period was £43m in 2016, while highest net sales were £59m in 2019.

Championship squad value (in accounting terms) has actually fallen from £87m in 2017 to £46m in 2020 (purchase cost £294m less player amortisation £248m). Note: the book values in the accounts are different from market values, which are invariably higher.

Transfer spend once again emphasises the difference between England’s top two divisions. In the last 10 years Premier League gross spend of £13.1 bln is 7 times as much as Championship £1.9 bln. The difference in net spend is even higher: £7.6 bln vs just £36m.

Championship clubs have only spent £409m on capital expenditure in the last ten years, mainly on stadium and training ground developments. That includes £47m in 2020, though only #FFC had a largish outlay of £29m (new stand) with the next highest being £4m at Brentford.

Loss-making Championship clubs pay hardly any corporation tax, only amounting to £8m in the last 10 years, though the #EFL would emphasise that they do contribute significant amounts to the Treasury via income tax paid by players and VAT collected by clubs.

As we have seen, almost all Championship debt is provided interest-free by club owners, so only £60m interest was actually paid in the 10 years up to 2020. There were only £6m payments in 2020 with just two clubs above £1m, namely Bristol City and Hull City.

The need for owners to put their hands in their pockets at Championship clubs is highlighted by them providing a hefty £2.9 bln of financing in the last 10 years, comprising £2.2 bln loans and £730m capital injections.

In fact, the £2.9 bln owner financing at Championship clubs is not far off Premier League £3.7 bln. However, Premier League spending is much higher on infrastructure £2.9 bln vs £409m, interest £918m vs £60m, dividends £153m vs £1m and tax £143m vs £8m.

The figures for the 2020/21 season are likely to look even worse for Championship clubs, as revenue will have been even more impacted by COVID with all games but the final one played behind closed doors, but finances in this division were pretty poor even before the pandemic.
• • •
Missing some Tweet in this thread? You can try to
force a refresh