While we wait for clubs to publish their accounts for the 2020/21 season, I thought it might be interesting to look at the trends in the Premier League over the last 10 years from 2011 to 2020, especially with COVID impacting last 3 months of 2019/20. Some thoughts follow #PL
#PL loss before tax widened in 2020 from £155m to £992m, as the initial effect of the pandemic began to bite. It is true that the division was already loss-making in 2019, but it had reported profits in 4 of the preceding 5 years, amounting to £1.3 bln in this period. 

The situation in the #PL was much the same after tax, though the 2020 loss was smaller at £953m, due to £39m tax credits. Tax accounting entries can have a major impact on net profits, e.g. 2018 included a £149m tax charge, while 2103 was boosted by £147m tax credit.


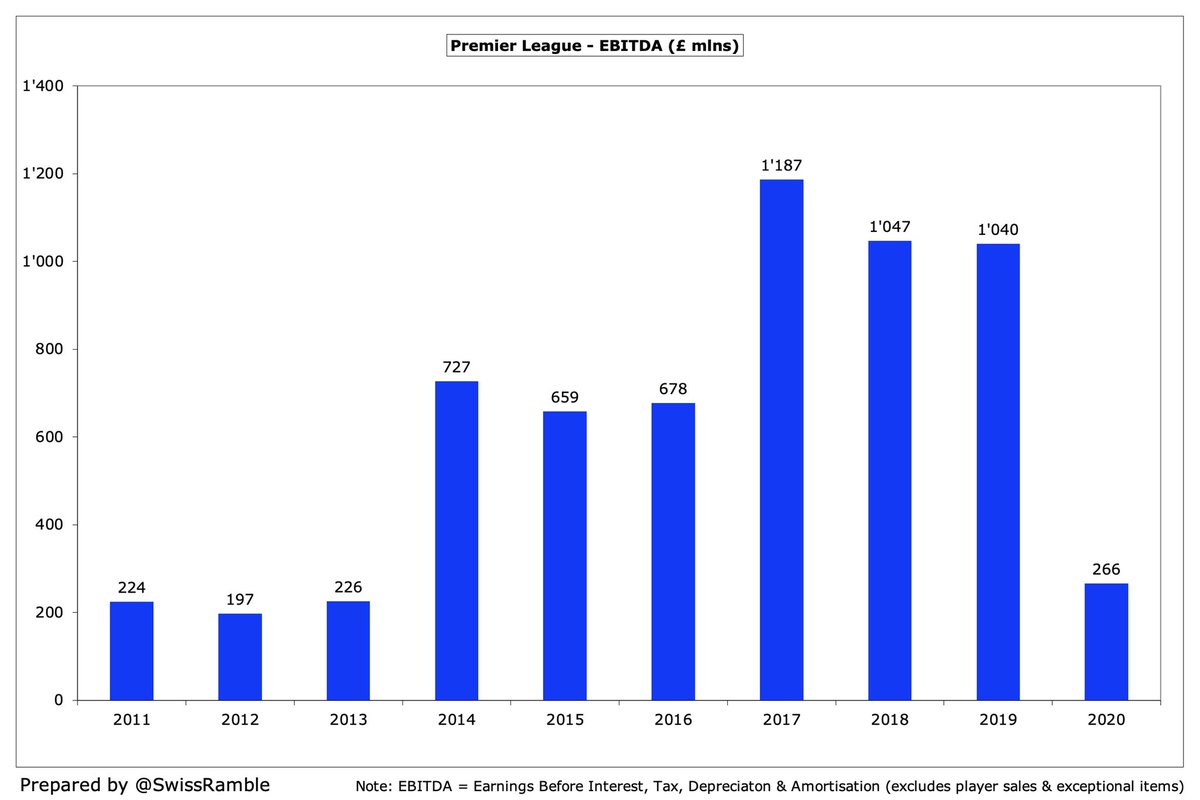
#PL EBITDA (Earnings Before Interest, Depreciation and Amortisation), which strips out player sales, non-cash items and interest to give underlying profitability, had been over £1 billion in each of the 3 years between 2017 and 2109, but dropped to £266m in 2020.
However, at an operating level, i.e. including player amortisation and depreciation, but excluding player sales and interest, most clubs lose money. #PL operating loss shot up from £490m to £1.4 bln in 2020. In fact, only made an operating profit once in the last 10 years.
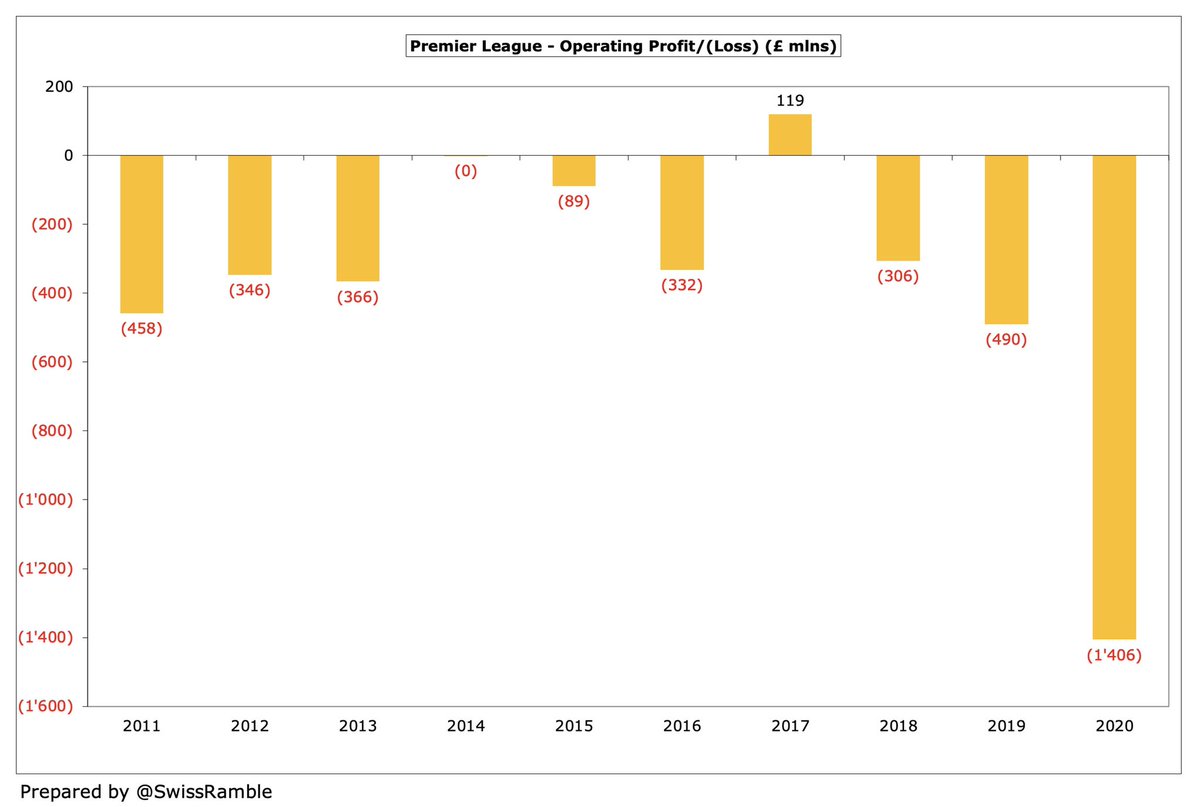
This emphasises the importance of profit from player sales to #PL profitability. This rose 25% from £434m to £542m in 2020, though this was much lower than the £836m peak in 2018. This will be an issue in 2021, as the transfer market has been less active during the pandemic.

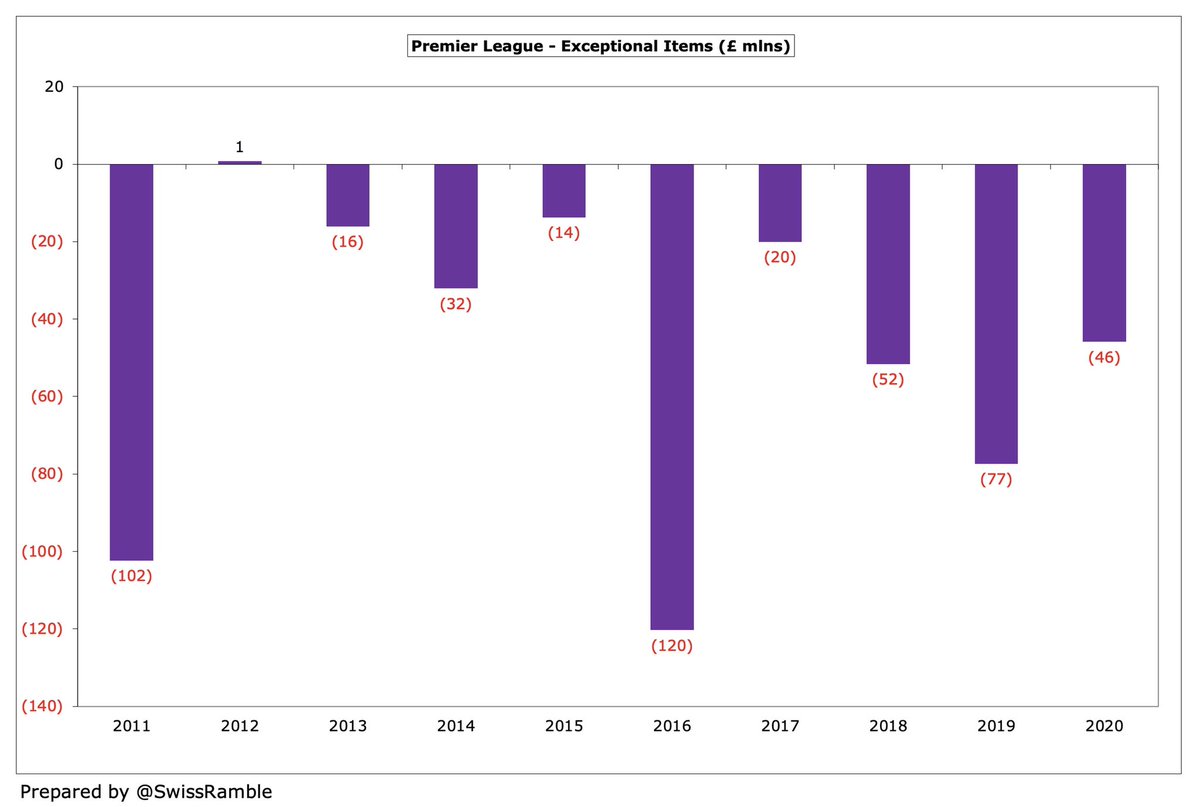
On the other hand, #PL bottom line is sometimes impacted by so-called exceptional charges, often severance payments to sacked managers. That said, the highest season was “only” £120m in 2106, including a £67 fee that #CFC made for early termination of a shirt sponsor.
#PL revenue had been on a steady upwards trend, more than doubling from £2.3 bln in 2011 to £5.2 bln in 2019, before falling £648m (13%) in 2020 to £4.5 bln. The effect of new 3-year broadcasting deals can be clearly seen, as they commenced in 2014 and 2017.

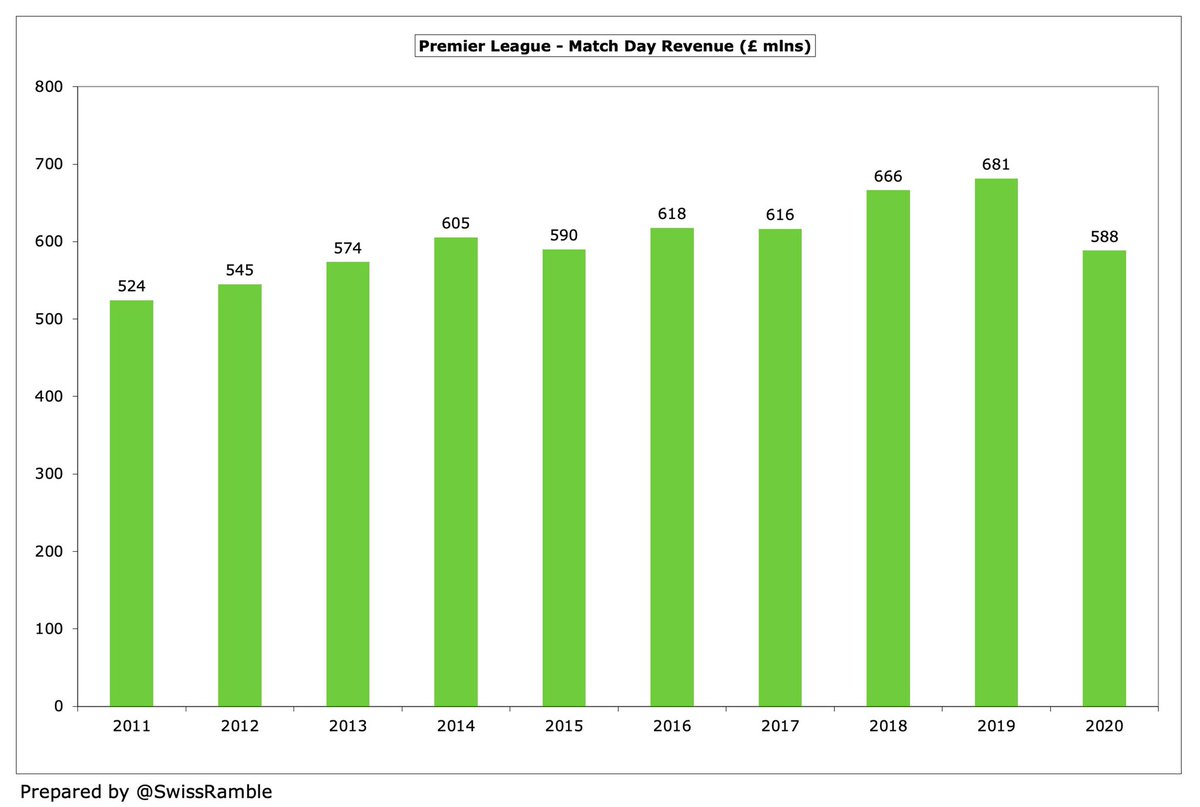
#PL match day income fell £93m (14%) in 2020 from £681m to £588m, the lowest since 2013, as COVID meant clubs played 4-6 games behind closed doors. Previous growth associated with stadium moves or expansion. Will be hardly anything in 2021, as virtually all games without fans.
Broadcasting revenue has been driving #PL growth, nearly tripling from £1.2 bln in 2011 to £3.0 bln in 2019, but dropped £718m (24%) to £2.3 bln in 2020, due to rebates to broadcasters and revenue deferred to 2020/21 accounts for games played after the 2019/20 accounting close.
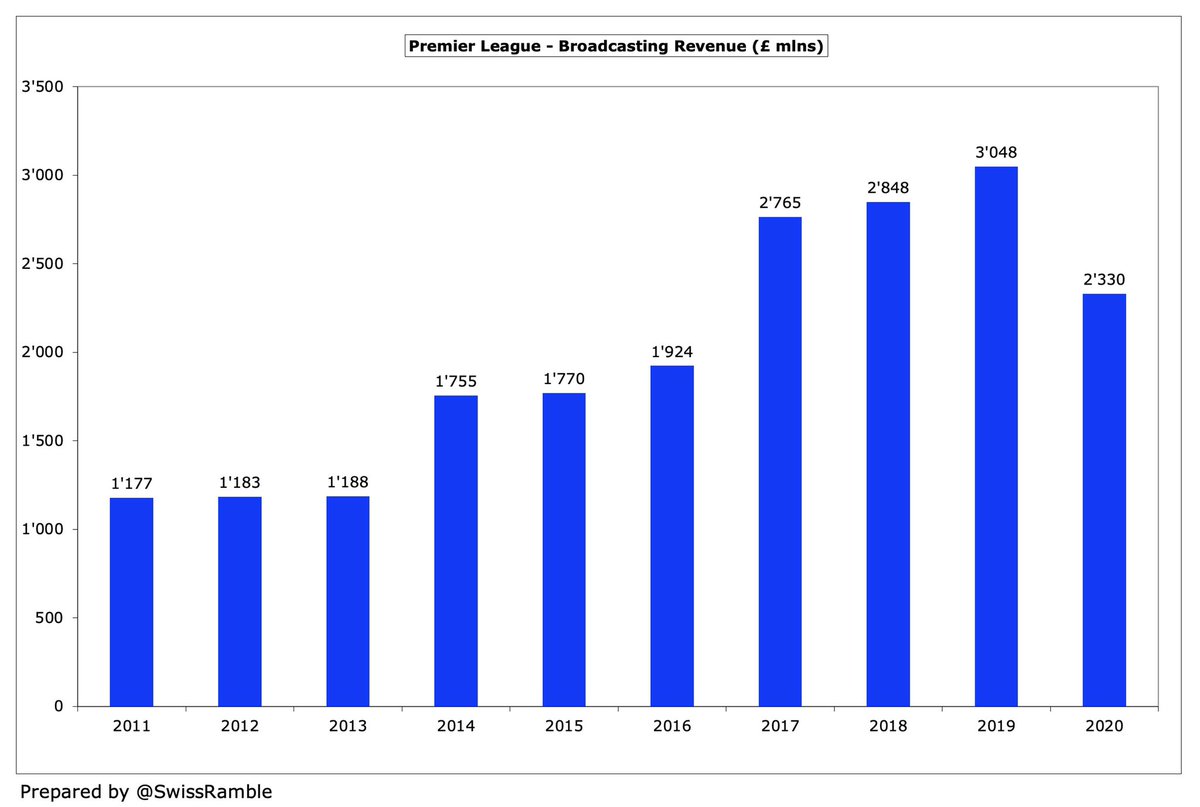
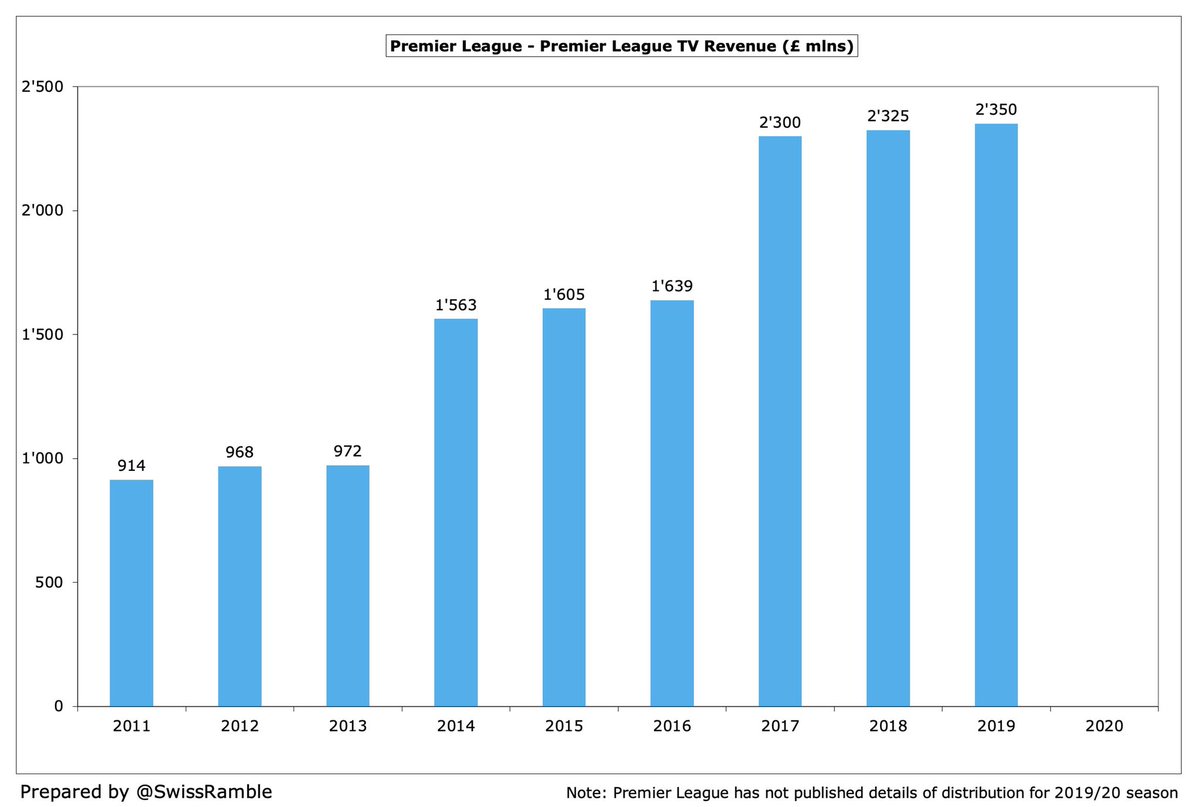
The #PL has not published details of TV money distributions for the 2019/20 season, but the beneficial impact of new 3-year deals is evident with significant upticks in both 2014, up from £972m to £1.6 bln, and 2017, up from £1.6 bln to £2.3 bln.
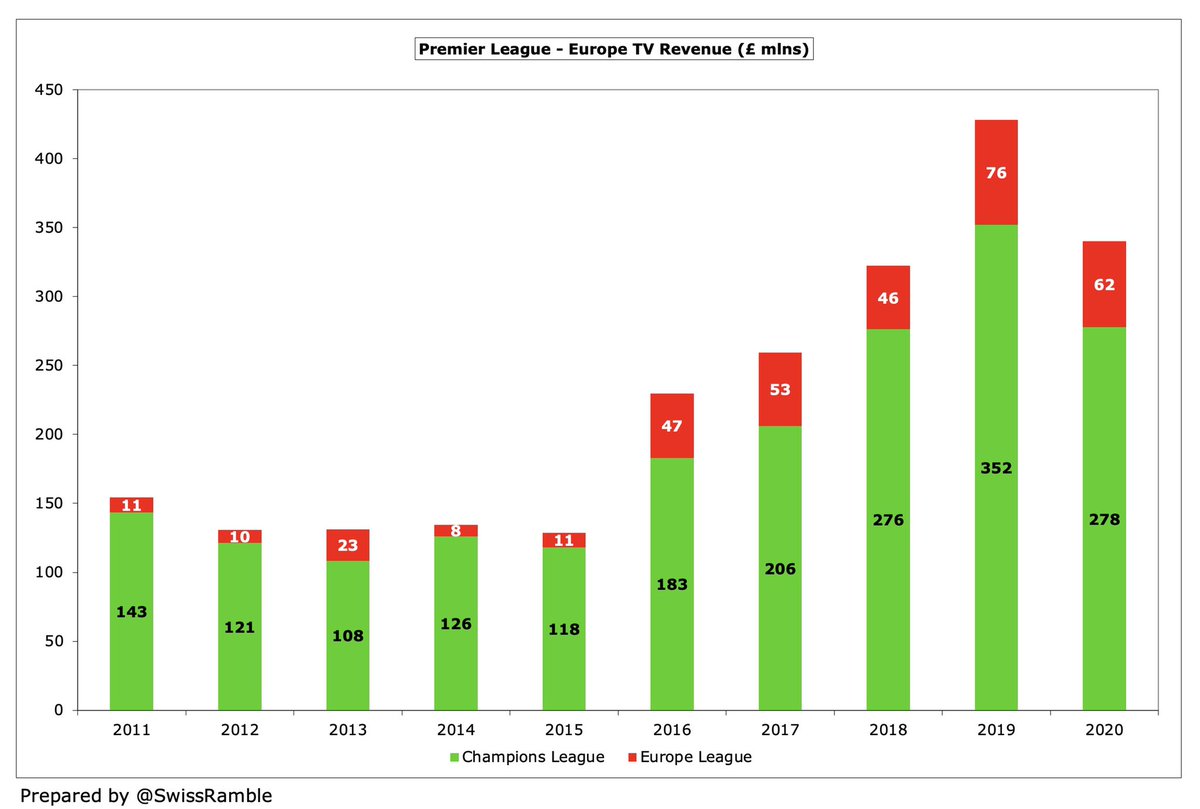
#PL TV money from Europe has also grown, especially in the last 5 years, partly due to new broadcasting deals, but also because English clubs have been more successful. However, this fell £88m (21%) in 2020 from £428m to £340m, split Champions League £278m and Europa League £62m.
#PL financial results in 2020 were helped by commercial revenue increasing £163m (11%) from £1.4 bln to £1.6 bln, mainly due to new sponsorships. This revenue stream has nearly tripled from £550m in 2011. However, may well fall in 2021, as commercial partners had less exposure.

Over the last decade the revenue mix at #PL clubs has significantly changed with match day reducing from 23% to 13%. Taking 2019 as a more normal season, broadcasting increased from 52% to 59%, while commercial also grew from 24% to 28%. 2020 is distorted by the pandemic.

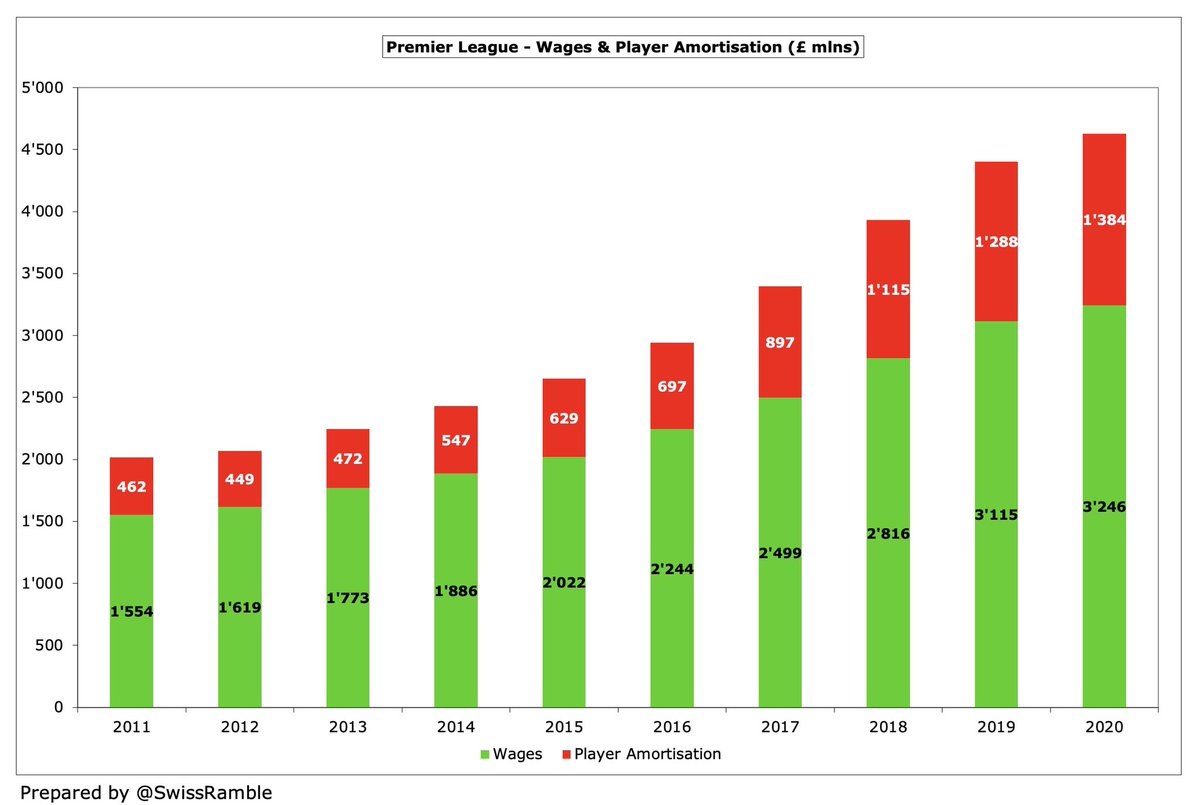
Despite the revenue decline in 2020, #PL wages continued to rise, increasing from £3.1 bln to £3.2 bln. Wage bills have grown every year in the last decade, more than doubling from £1.6 bln in 2011.

#PL wages to turnover ratio tends to decrease (improve) in the first year of the 3-year TV rights cycle (e.g. from 70% to 58% in 2014 and 62% to 55% in 2017), then slowly rise over next two years. However, this shot up from 60% to 72% in 2020, due to COVID reducing revenue.

#PL player amortisation, the annual charge to write-off transfer fees over the contract, has also grown significantly from £462m in 2011 to £1.4 bln, including £96m increase in 2020. High squad investment means this expense has really surged in last 4 years, doubling since 2016.

Combining wages and player amortisation highlights how these costs have increased in #PL, rising from £2.0 bln in 2011 to a staggering £4.6 bln in 2020. In fact, £2.0 bln of that £2.6 bln growth has come in last 5 years alone, including £227m in 2020, despite the revenue fall.
As a result, the #PL ratio of wages and player amortisation over turnover broke through the 100% barrier in 2020, which means that clubs were already losing money before paying other expenses and interest (often to be compensated by player sales).

#PL other expenses, effectively the clubs’ running costs, have also steadily increased in the past decade, rising from £484m to just over £1 bln. These slightly dipped in 2020, but should fall further in 2021, as there were lower costs incurred for staging matches.

#PL depreciation increased from £127m to £182m in 2020, mainly due to the cost of the new #THFC stadium. The only other clubs with an annual charge over £10m were #MUFC, #AFC and #MCFC.

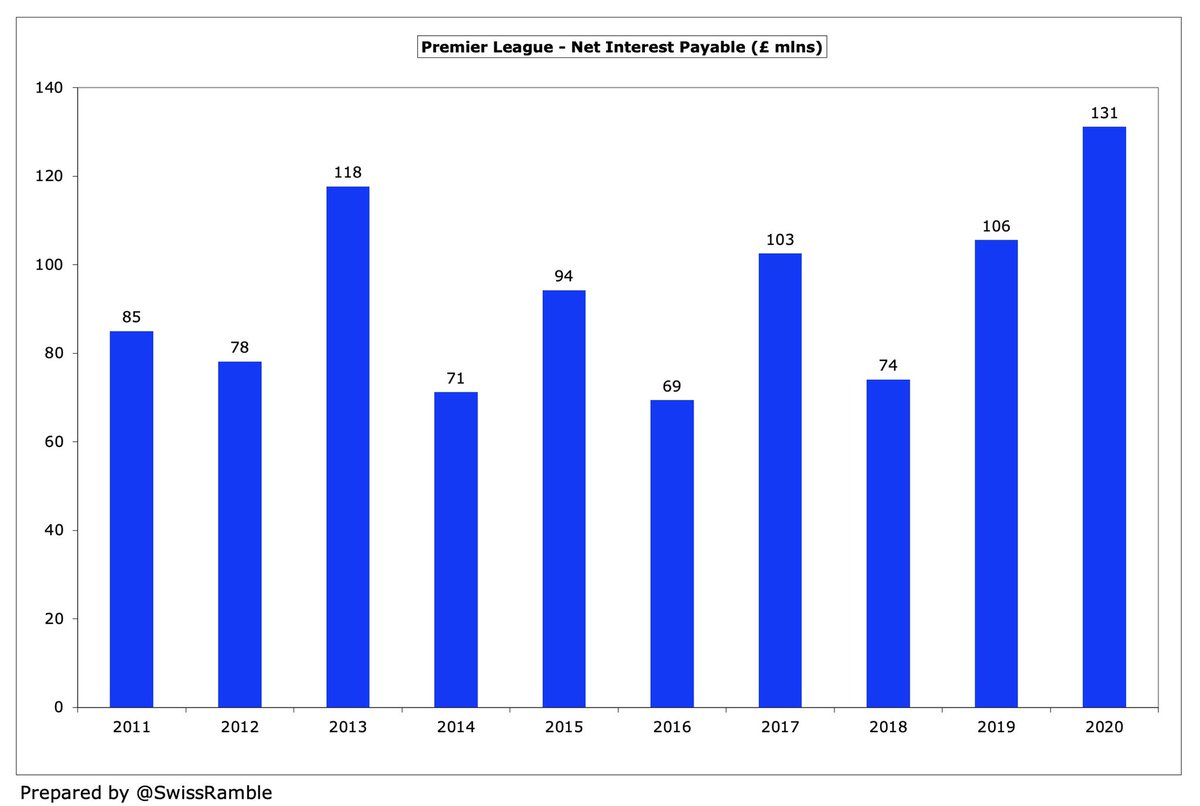
#PL net interest payable also increased in 2020 from £106m to £131m, with nearly two-thirds of this coming from just 3 clubs: #THFC, #MUFC and #AFC. Note: this does not necessarily mean this interest was paid, but could be only non-cash accounting entries.
After many years when #PL debt levels were relatively flat, this has surged in the last three years, rising from £2.0 bln in 2017 to £3.7 bln in 2020, the highest ever in England’s top flight. It increased by £554m in 2020 alone.

Much of #PL debt increase over last three years has come via loans from club owners. This “soft” debt has almost doubled since 2017, rising by £715m from £782m to £1.5 bln. Clubs with over £100m owner debt: #EFC £350m,#BHAFC £304m, #LCFC £128m, #AFCB £126m and #NUFC £107m.

However, the majority of the #PL debt increase over the last three years is driven by external funding, which is up nearly a billion since 2017 from £1.2 bln to £2.2 bln. Largest external debt: #THFC £831m, #MUFC £526m, #AFC £203m and #LFC £197m.

The #PL debt increase would have been even higher without owners either converting their loans to equity (£911m in last 10 years) or writing-off amounts owed to them (£90m), though most of that took place in the five years between 2011 and 2015 and hardly any recently.

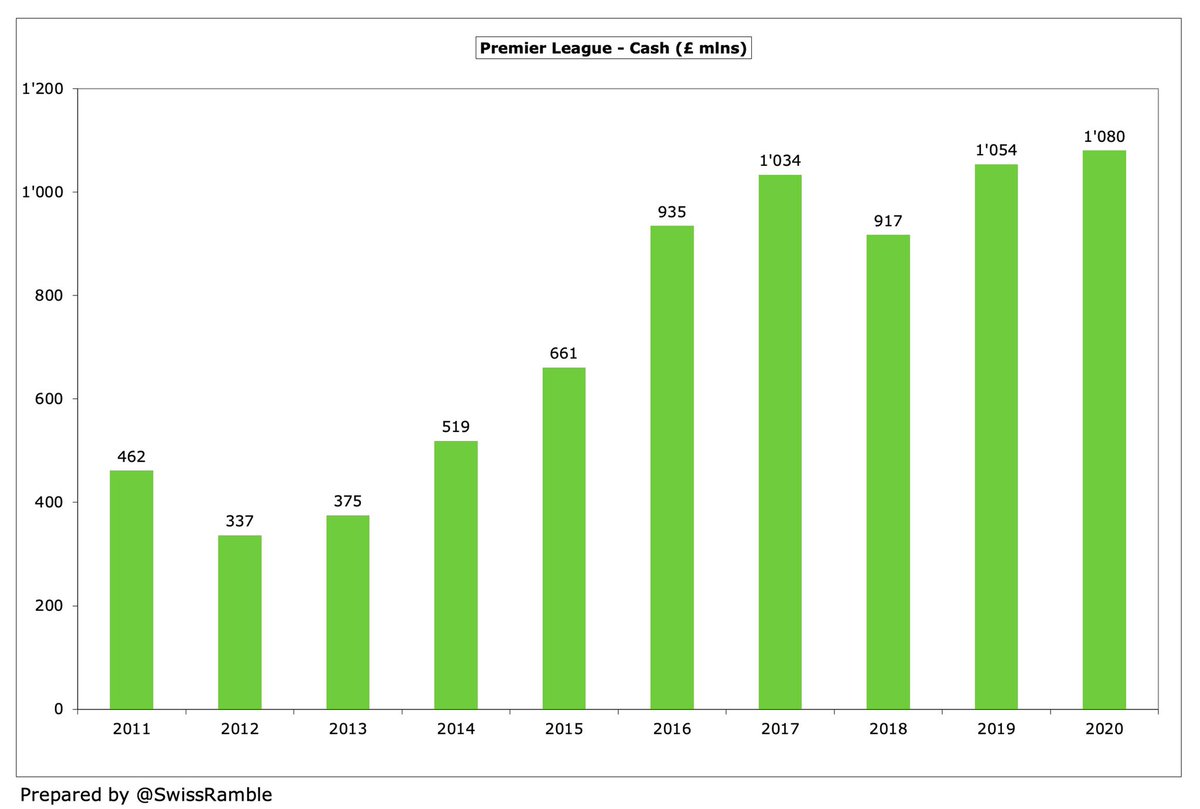
#PL cash balances have held fairly steady over last 5 years at around £1 bln, though 2020 is a little misleading: #THFC £226m is due to new stadium loans, while others took on loans to cope with COVID shortfalls, and extended accounting close meant part of 2021 TV money included.
Much of the higher #PL transfer spend has been funded on credit by increasing transfer debt, i.e. stage payments on transfer fees, which has grown by £1.5 bln since 2017 from £1.1 bln to £2.6 bln, including £1.0 bln in 2020 alone. In contrast, transfer receivables are down.

That said, #PL gross transfer spend has actually dropped by a quarter since the £2.4 bln peak in 2018 to £1.8 bln to 2020, though this is still the third highest ever for the English top tier. The outlay for the last three years was a hefty £6 bln

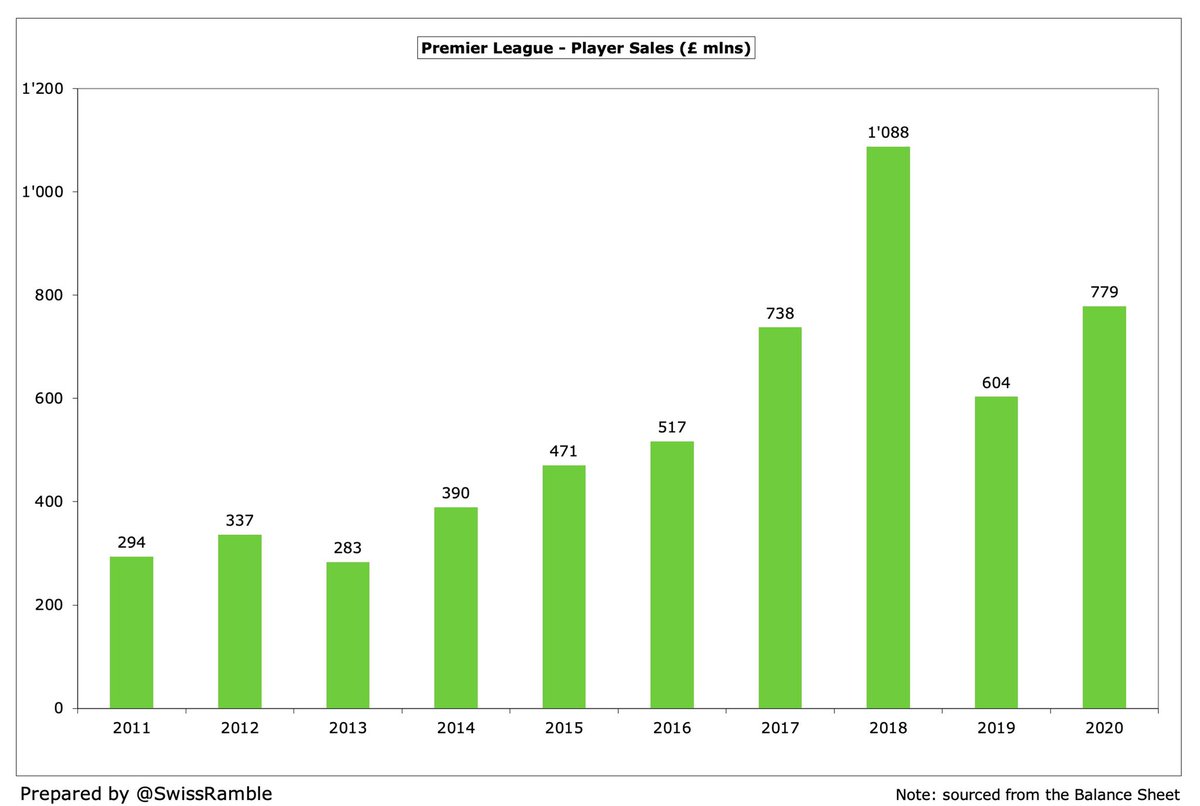
#PL player sales have also dropped from the 2018 peak of £1.1 bln to £779m in 2020, though this was actually £175m higher than 2019. Player sales for the last three years amounted to £2.5 bln.
As a consequence, #PL net spend has been over one billion in each of the last three years, adding up to £3.5 bln in that period. However, net spend has dropped from around £1.3 bln in both 2018 and 2019 to (still sizeable) £1.0 bln in 2020.

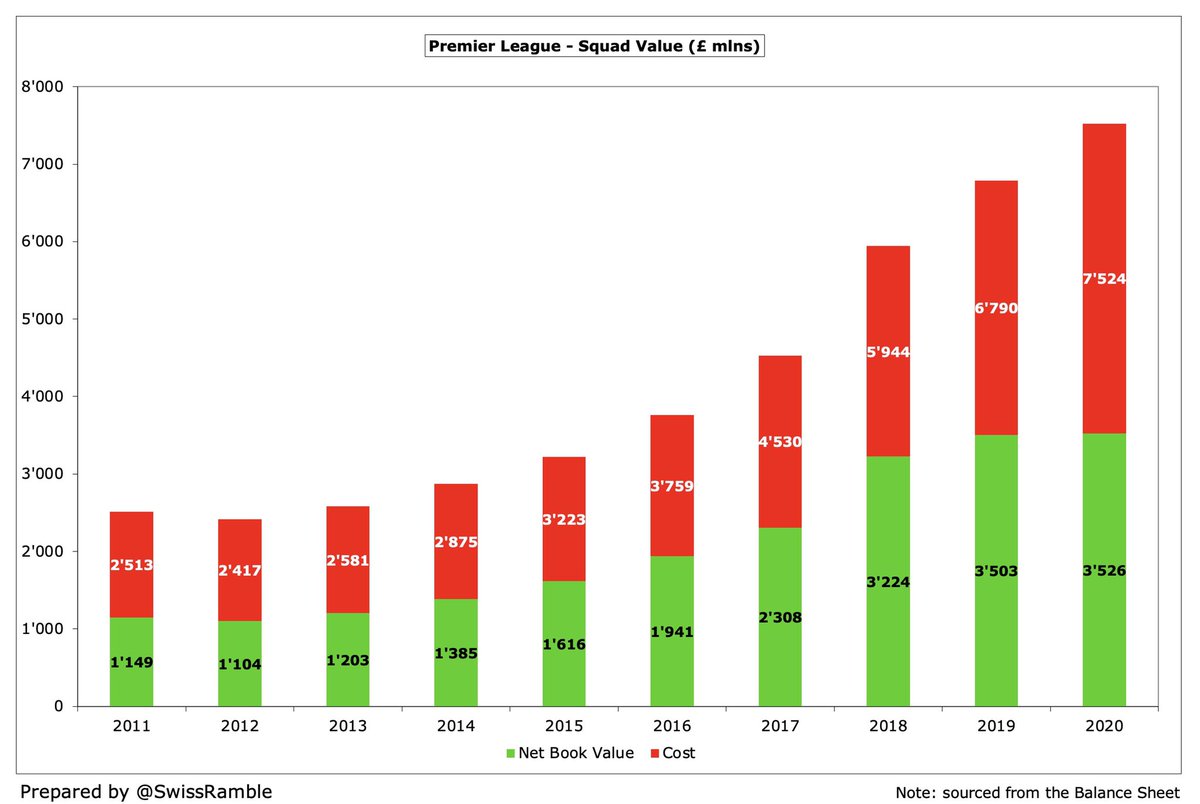
#PL squad value has logically also grown. Purchase cost stands at £7.5 bln, so three times as much as £2.5 bln in 2011, while net book value (after charging player amortisation) is £3.5 bln. Note: the values in the accounts are different from market values.
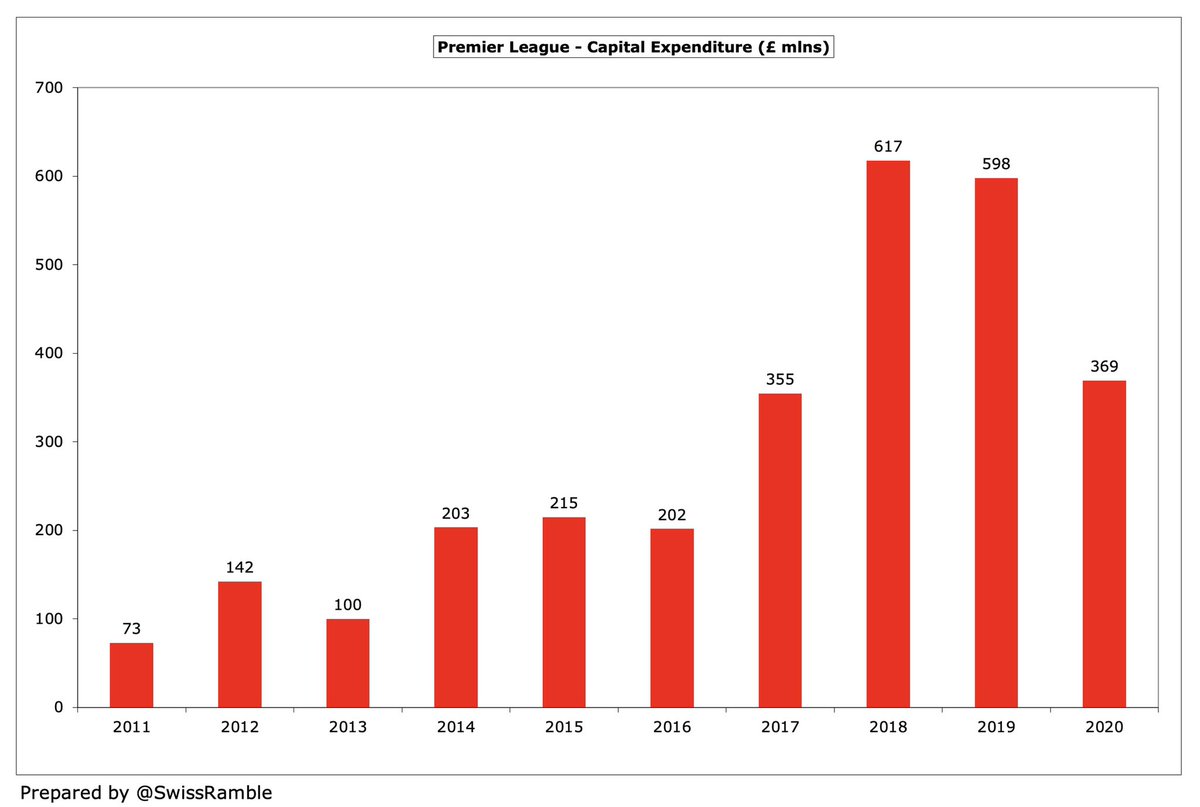
#PL clubs have spent almost £2 bln on capital expenditure in the last four years, mainly on stadium and training ground developments, though this dropped from £598m in 2019 to £369m in 2020, mainly #THFC £82m, #LCFC £75m, #SUFC £49m and #LFC £39m.
Premier League clubs pay hardly any corporation tax, only amounting to £143m in the last 10 years, though the #PL would emphasise that they do contribute significant amounts to the Treasury via income tax paid by players and VAT collected by clubs.

Although debt has increased, #PL net interest paid (cash outlay) has actually fallen to £66m, due to a combination of interest-free owner loans and falling interest rates. Highest interest in 2020 was #MUFC £19m, which was also the case in 2011, when they paid a staggering £166m.

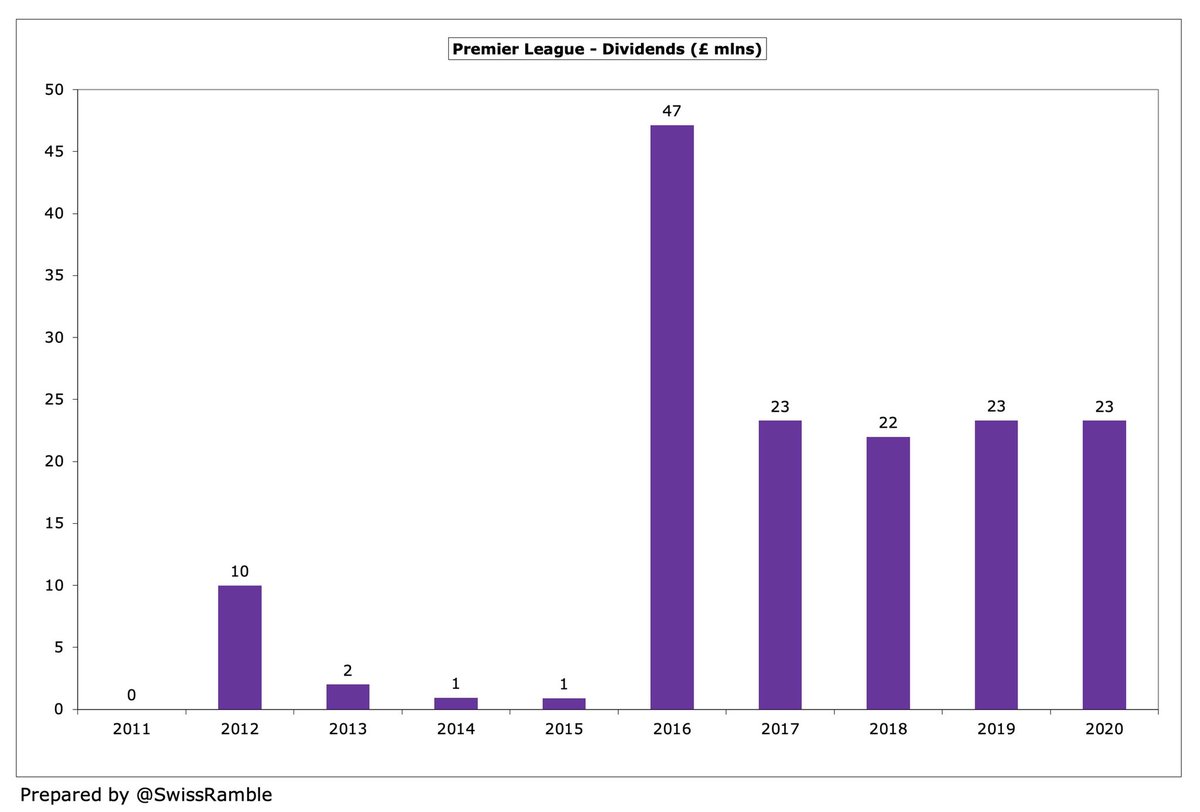
Similarly, the only #PL club that has consistently paid dividends to its owners is #MUFC, which accounts for £122m of the £153m payments in the last decade, averaging an annual £22m over the last five years.
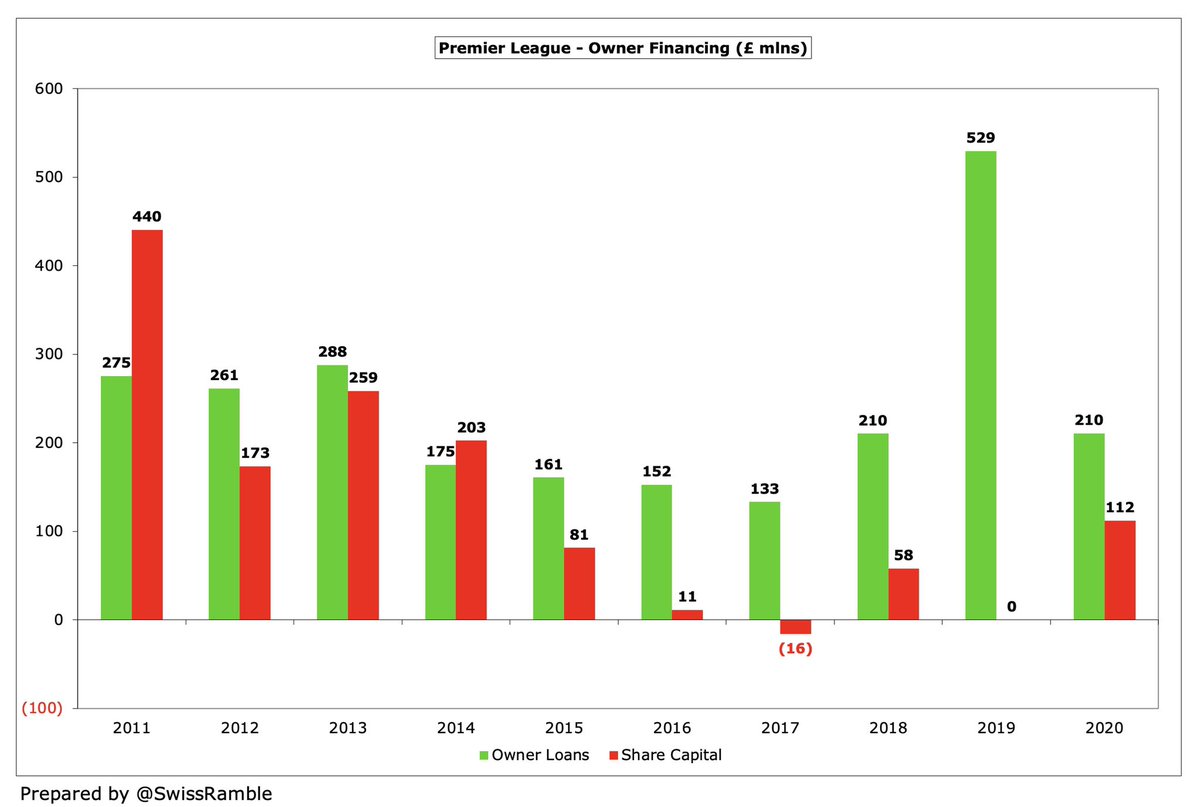
#PL owners have provided £3.7 bln funding in the last 10 years, comprising £2.4 bln loans and £1.3 bln capital injections. The most generous owners in this period have been #MCFC £1.1 bln, #CFC £570m, #AVFC £459m, #EFC £348m, #BHAFC £325m and #LCFC £312m.
The figures for the 2020/21 season are likely to look very different for #PL clubs, as revenue will have been even more impacted by the pandemic, with all games but the final one played behind closed doors, but the 2020 results already highlighted a slowdown.
• • •
Missing some Tweet in this thread? You can try to
force a refresh