1/ When #ALTSEASON THREAD🔥🔥
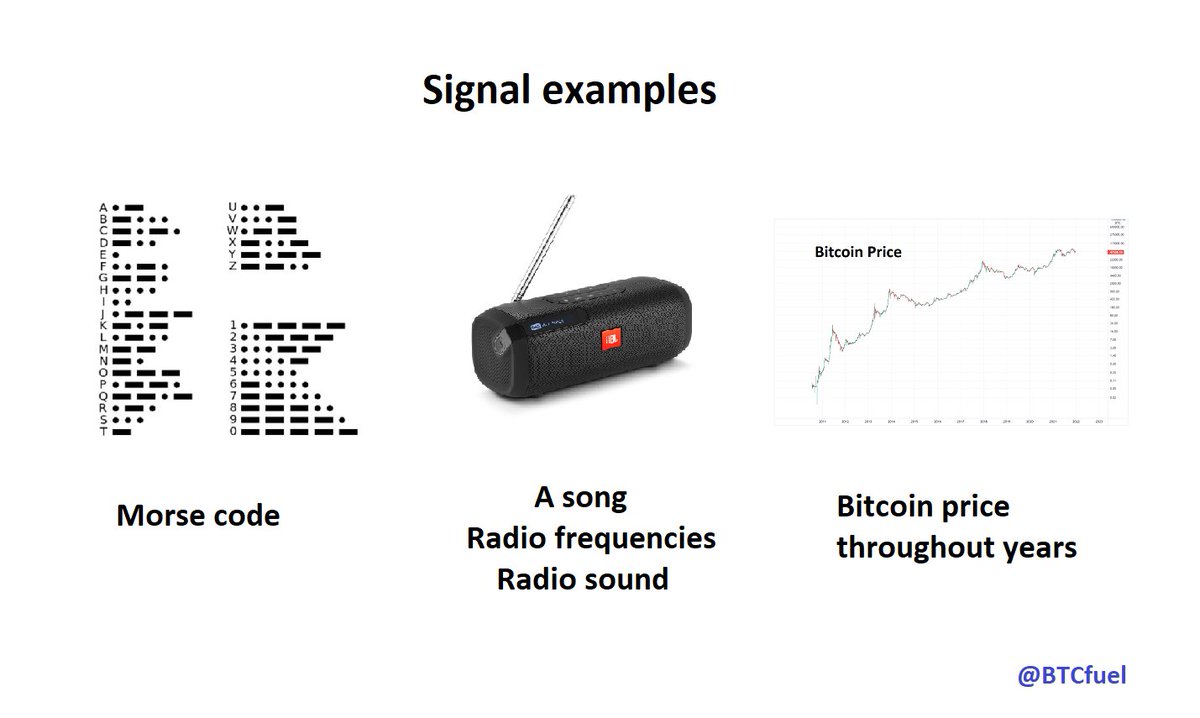
In this thread I am looking at #crypto market structures to assess when an #altcoin market peak should happen and as a consequence #altseason, which happens in the weeks before the peak
In this thread I am looking at #crypto market structures to assess when an #altcoin market peak should happen and as a consequence #altseason, which happens in the weeks before the peak

2/ To assess when the next #altseason peak will happen, I’ll be looking at charts of #Bitcoin, #Ethereum and the dominance of #altcoins of the different past altseasons. By aligning them “correctly” structure-wise, I found this provisional target zone when the peak should happen

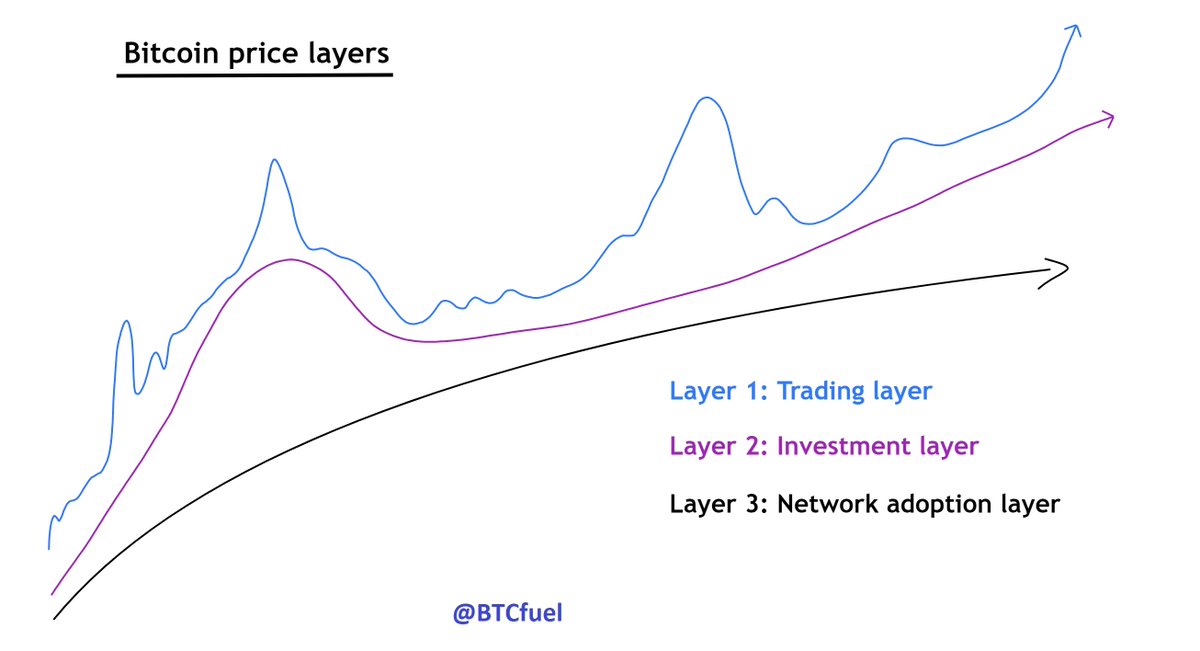
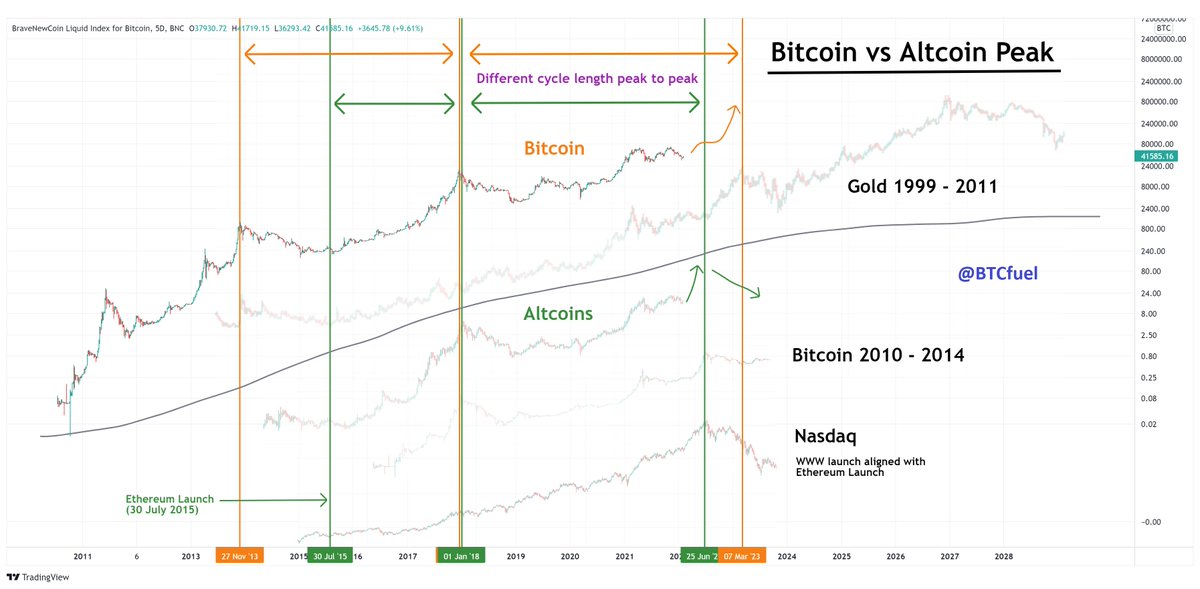
3/ Before getting started, where are #altcoins in their “market curve”? When compared to #Bitcoin one can see that they are entering the final leg up of the hype phase. This is the altcoin bubble. Bitcoin on the other hand is in the liftoff phase

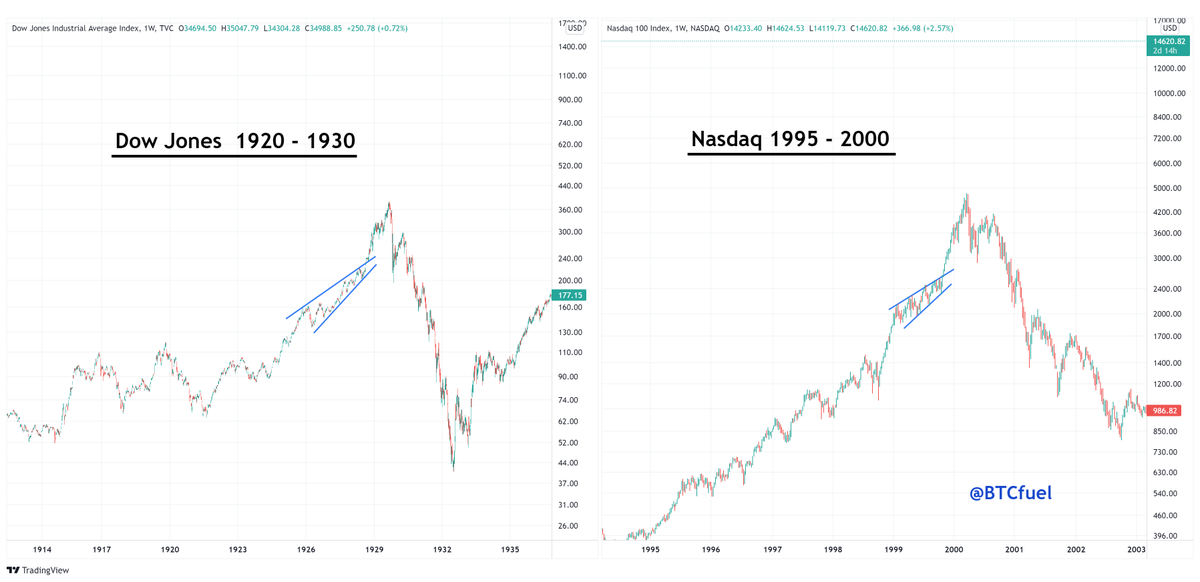
4/ #Bitcoin and #altcoins are thus in a different stage of the market curve. In this chart you see altcoins structurally aligned with the hype phases of Bitcoin in 2010-2014 and the Nasdaq Dotcom bubble. Bitcoin is aligned with the gold liftoff in 1999-2011
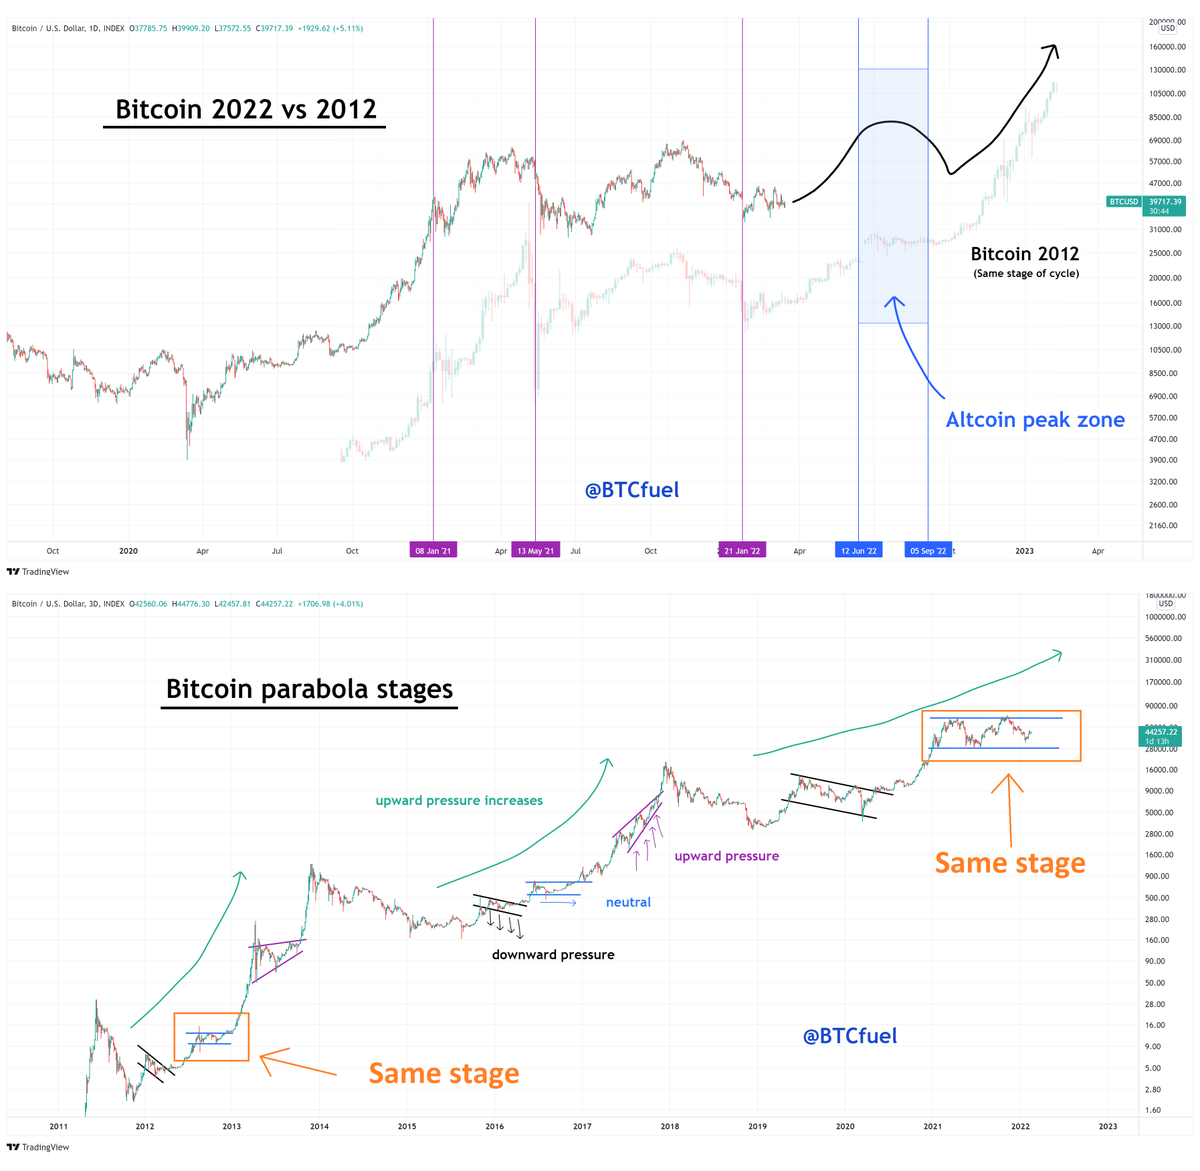
5/ Within a single bull market cycle, #Bitcoin is not as far progressed as #altcoins. Bitcoin is in its “neutral stage”. Altcoins are in the next stage, the rising wedge before the top

6/ This gets us to the first comparison. #Altcoins are possibly in the final stage of the “Altcoin bubble”. They are now in the rising wedge before the top. This structural comparison with the Nasdaq Dotcom bubble gives us as a target: 11 July 2022

7/ When instead of comparing with the structure of the Nasdaq Dotcom bubble, looking at the launch of #ethereum and the WWW, one gets as a target: 10 June 2022

8/ #Bitcoin looks like it’s building a base similar to the big 2019-2020 base. In the summer of 2020 an #altseason happened. The same timespan from the March 2020 Covid crash to the summer 2020 altseason peak gives us as a target: 30 June 2022

9/ #Bitcoin is in its “neutral stage”. The neutral stage in 2012 looked very similar to 2022. I expect it to play out similarly now, with a bump during summer when it moves a bit with #altcoins. Bitcoin likely peaks later in 2023. Target for altcoins: Summer 2022
10/ At the end of the 2016 “neutral stage”, a big #altseason happened in the spring of 2017 for about 3 months. #Bitcoin had a similar slowly increasing volume profile. This gives room (volume) for alts to grow. Target Summer 2022

11/ Strong movements of #Ethereum were in the past the beginning of #altseason. Structurally the Ethereum price right now is very similar to 2016-2017. When it broke through the moving averages it was 6 months to the top. Target: Summer 2022

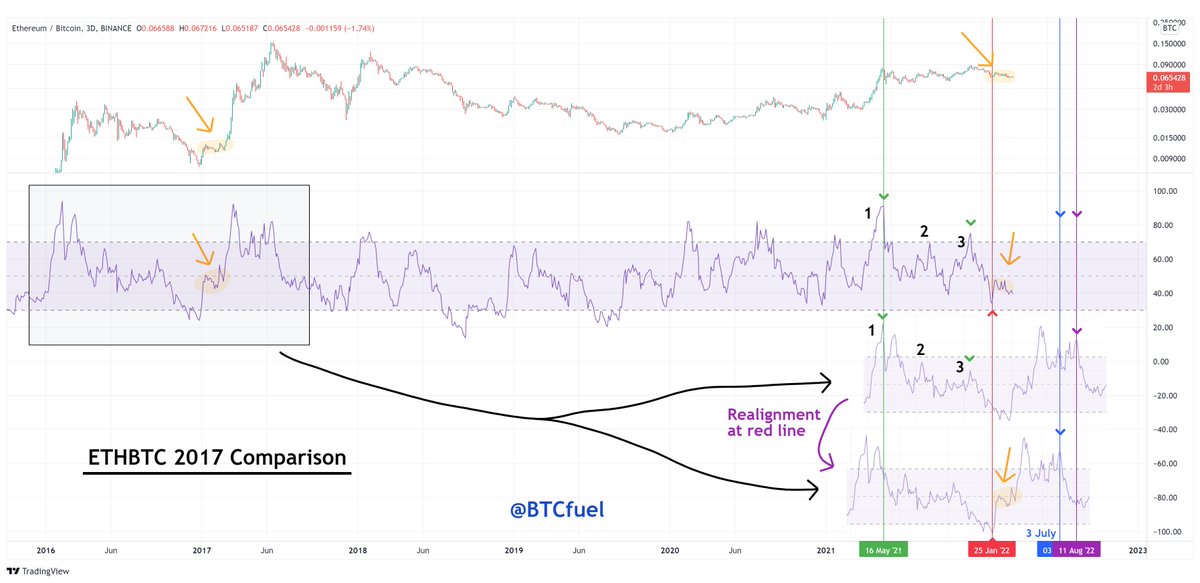
12/ Looking at the #Ethereum - #Bitcoin pair is also interesting, when it moves up Ethereum outperforms Bitcoin. The comparison of the similar RSI pattern of 2016-2017 gives two possible targets: 3 July and 11 August 2022
13/ The #Ethereum - #Bitcoin structure of 2019 – 2021 is also very similar to the 2021 – 2022 structure. Especially the structure in the middle gives it away. Target: 7 June 2022
FYI: In the past the Ethereum - USD peak was within days of the #altcoin market peak
FYI: In the past the Ethereum - USD peak was within days of the #altcoin market peak

14/ The others chart is a chart of the top 125 #altcoins with about 10 big marketcap coins excluded. It gives us the best signal of the #altcoin market. A comparison with the 2017 structure gives us this target: 12 September 2022

15/ The RSI profile of the others chart of this bull market also shows some structural similarities with the previous bull market. Target: 25 July 2022

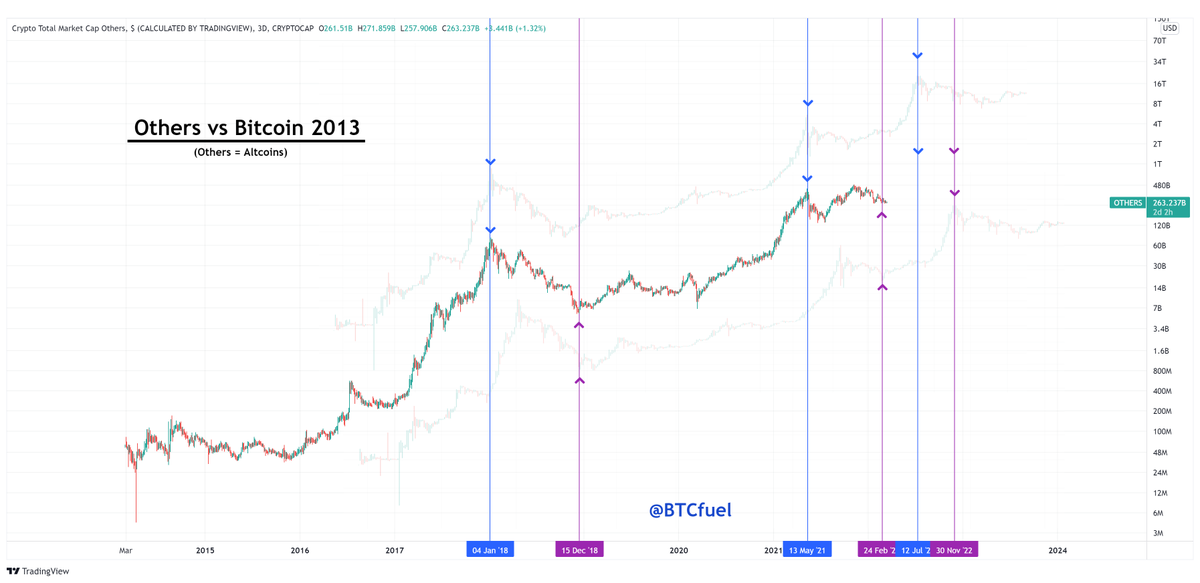
16/ The others chart compared with 2010-2014 #Bitcoin. Both are in their hype phase according to the market curve I’ve shown above. I chose two different alignments, one aligned for bottoms, one for tops. Targets: 12 July and 30 November 2022
17/ Now let’s take a look at the #Bitcoin dominance chart. A similar setup as 2019-2020 is visible. Pattern comparison gives us target: 2 August 2022
I expect a bigger drop / #altseason to happen than summer 2020
I expect a bigger drop / #altseason to happen than summer 2020

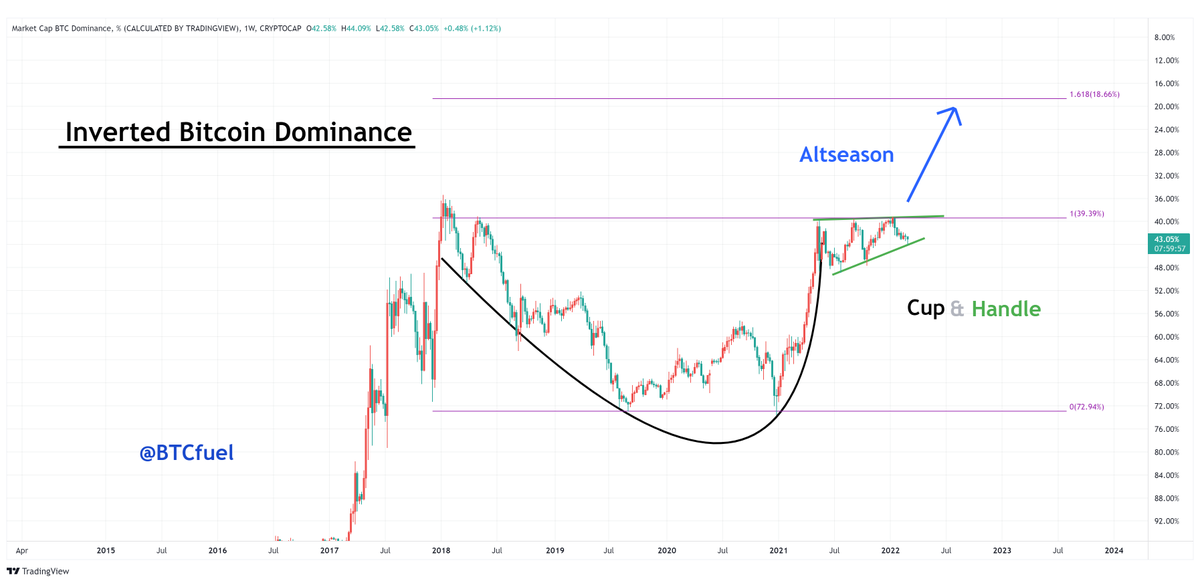
18/ The #Bitcoin dominance chart upside down also shows a beautiful Cup & Handle pattern
It shows a very big #altseason
It shows a very big #altseason
19/ The #Bitcoin dominance chart also shows similarities with 2017, however it is better visible in the others dominance chart. That one resembles 2016-17 Bitcoin dominance (It's named Altcoin dominance on the bottom chart)

20/ Now jumping back to 2019-2020. The Others dominance chart of 2019-2020 looks similar to 2021-2022. Target: 21 July 2022

21/ The mania part of #altseason starts when the price leaves the rising wedge. Then it’s only a couple of weeks to the top. Staying longer within the wedge could cause delays in the timing

22/ All these patterns represent flows of money and psychology processes. The altcoin peak happens when each of these patterns gets completed. Timing can change (/be delayed) when it takes more time to go through them. A delay should be max 2-3 months IMO (blue zone)

23/ The end
Follow me @BTCfuel for more analysis
Please RETWEET this thread 🔃
Follow me @BTCfuel for more analysis
Please RETWEET this thread 🔃
https://twitter.com/BTCfuel/status/1504442458008170505
• • •
Missing some Tweet in this thread? You can try to
force a refresh