26-AUG-22 UPDATE
1/25
In this 🧵, we update #COVID19 incidence, hospitalizations, deaths, and disparities for 🇺🇸 children and adolescents.
Please share this 🧵 #epitwitter #PedsICU #tweetiatrician #SARSCoV2 #Omicron #LongCovidKids
covkidproject.org
1/25
In this 🧵, we update #COVID19 incidence, hospitalizations, deaths, and disparities for 🇺🇸 children and adolescents.
Please share this 🧵 #epitwitter #PedsICU #tweetiatrician #SARSCoV2 #Omicron #LongCovidKids
covkidproject.org
26-AUG-22 UPDATE
6/25
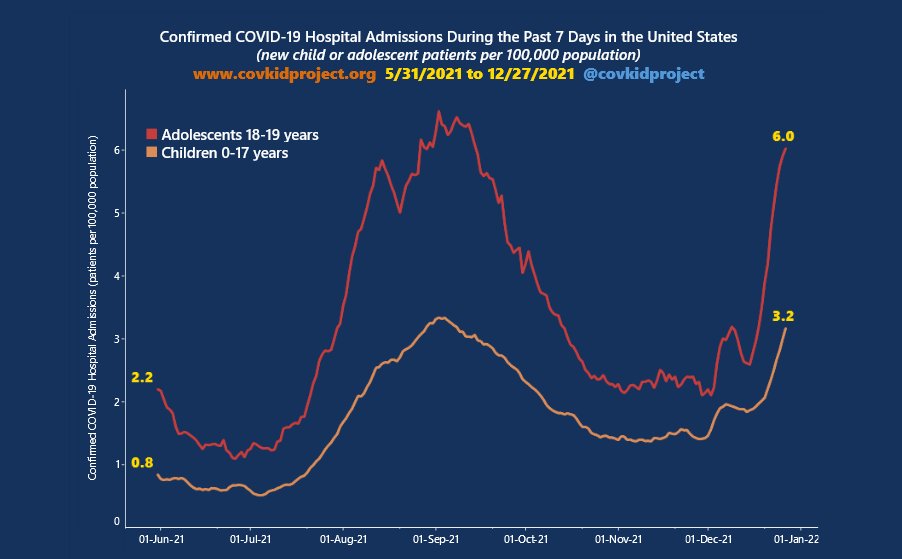
The number of 🇺🇸 kids currently hospitalized with #COVID19 has plateaued at a level 3X higher than the April 2022 low, and >4X higher than the July 2021 low.
covkidproject.org/hospitalizatio…
6/25
The number of 🇺🇸 kids currently hospitalized with #COVID19 has plateaued at a level 3X higher than the April 2022 low, and >4X higher than the July 2021 low.
covkidproject.org/hospitalizatio…

26-AUG-22 UPDATE
7/25
Over 1600 🇺🇸 children & adolescents aged 0-19 yrs have died from #COVID19 since Jan 2020. The national cumulative death rate = 19.8 deaths/million. Regionally, child/teen mortality has been highest in #Southwest & #Southeast states.
covkidproject.org/deaths
7/25
Over 1600 🇺🇸 children & adolescents aged 0-19 yrs have died from #COVID19 since Jan 2020. The national cumulative death rate = 19.8 deaths/million. Regionally, child/teen mortality has been highest in #Southwest & #Southeast states.
covkidproject.org/deaths

26-AUG-22 UPDATE
9/25
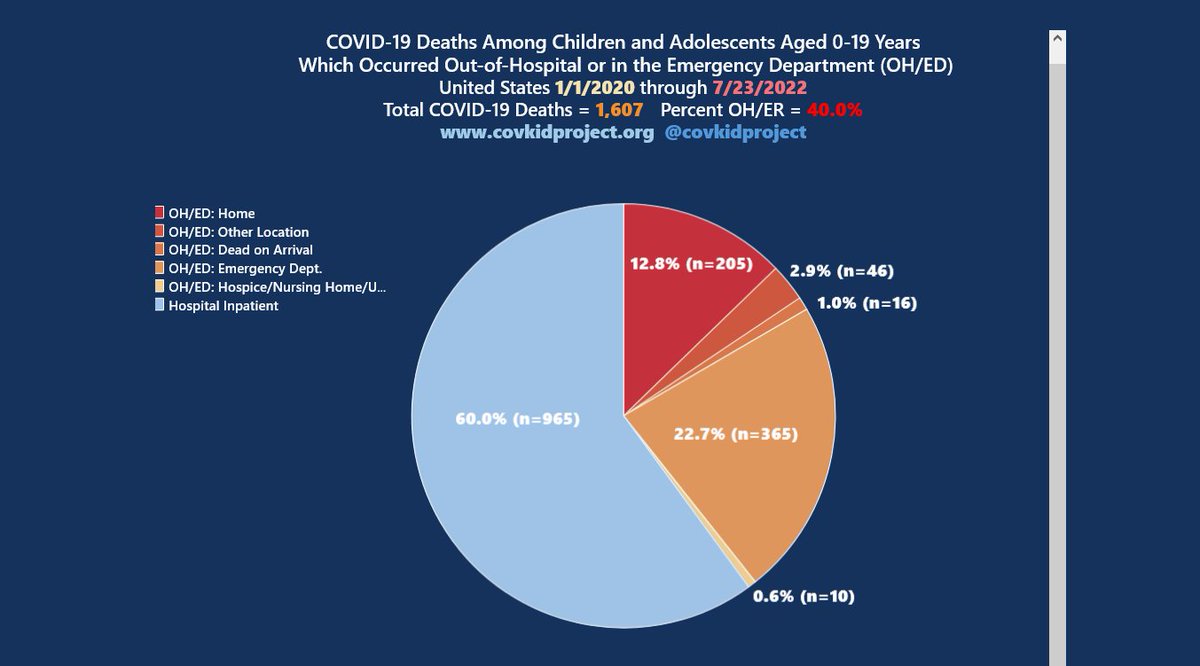
We first reported the problem of kids dying from #COVID19 outside of a hospital or in the emergency department (OH/ED) in our peer-reviewed paper in @AMJPublicHealth (July 2021)
@JanelleMMenard @BexzieGarcia @JasonSalemi
ajph.aphapublications.org/doi/full/10.21…
9/25
We first reported the problem of kids dying from #COVID19 outside of a hospital or in the emergency department (OH/ED) in our peer-reviewed paper in @AMJPublicHealth (July 2021)
@JanelleMMenard @BexzieGarcia @JasonSalemi
ajph.aphapublications.org/doi/full/10.21…
26-AUG-22 UPDATE
10/25
The latest #COVID19 death data from @NCHStats shows the situation has not improved: 40% of 🇺🇸 kids died OH/ED.
A child dying in the ED means that child received medical care too late - they never made it to the #PICU
#PedsICU
covkidproject.org/deaths
10/25
The latest #COVID19 death data from @NCHStats shows the situation has not improved: 40% of 🇺🇸 kids died OH/ED.
A child dying in the ED means that child received medical care too late - they never made it to the #PICU
#PedsICU
covkidproject.org/deaths

26-AUG-22 UPDATE
11/25
The percent of #COVID19 deaths among kids which occurred OH/ED varied by state: >50% in MA, MN, OH, OK, SC, WA.
covkidproject.org/deaths
11/25
The percent of #COVID19 deaths among kids which occurred OH/ED varied by state: >50% in MA, MN, OH, OK, SC, WA.
covkidproject.org/deaths

26-AUG-22 UPDATE
12/25
The majority of the 1,607 🇺🇸 child/teen #COVID19 decedents have been racial/ethnic minorities, with 28.5% non-Hispanic white.
covkidproject.org/disparities
12/25
The majority of the 1,607 🇺🇸 child/teen #COVID19 decedents have been racial/ethnic minorities, with 28.5% non-Hispanic white.
covkidproject.org/disparities

26-AUG-22 UPDATE
13/25
Cumulative #COVID19 mortality rates through 23-JUL-22 reveal significant disparities for Indigenous (RR 2.8, 95%CI 2.0-4.0), Black (RR 2.4, 95%CI 2.1-2.7), and Hispanic (RR 1.4 95%CI 1.2-1.6) kids compared with whites.
covkidproject.org/disparities
13/25
Cumulative #COVID19 mortality rates through 23-JUL-22 reveal significant disparities for Indigenous (RR 2.8, 95%CI 2.0-4.0), Black (RR 2.4, 95%CI 2.1-2.7), and Hispanic (RR 1.4 95%CI 1.2-1.6) kids compared with whites.
covkidproject.org/disparities

26-AUG-22 UPDATE
14/25
The #COVID19 mortality disparity for Black vs. white kids has widened over time, as shown in this plot of cumulative monthly death rates.
Keep in mind these are mortality rates (deaths per million pop), NOT case fatality rates!
covkidproject.org/disparities
14/25
The #COVID19 mortality disparity for Black vs. white kids has widened over time, as shown in this plot of cumulative monthly death rates.
Keep in mind these are mortality rates (deaths per million pop), NOT case fatality rates!
covkidproject.org/disparities

26-AUG-22 UPDATE
15/25
The Black-white #COVID19 death disparity for kids was highest during the #DeltaVariant and #Omicron surges.
B/c we lack high-quality case data for kids by race/ethnicity, the contributions of ⬆️ incidence vs. ⬆️ case fatality are unknown.
#epitwitter
15/25
The Black-white #COVID19 death disparity for kids was highest during the #DeltaVariant and #Omicron surges.
B/c we lack high-quality case data for kids by race/ethnicity, the contributions of ⬆️ incidence vs. ⬆️ case fatality are unknown.
#epitwitter

26-AUG-22 UPDATE
16/25
When #COVID19 mortality (deaths/pop) disparities can mainly be attributable to ⬆️ case fatality (deaths/cases), there may be differences in case severity, but the most likely explanation is disparities in timely access to medical care.
16/25
When #COVID19 mortality (deaths/pop) disparities can mainly be attributable to ⬆️ case fatality (deaths/cases), there may be differences in case severity, but the most likely explanation is disparities in timely access to medical care.

26-AUG-22 UPDATE
17/25
Racial/ethnic disparities in #COVID19 mortality among kids arise from #structuralracism operating at multiple geographic scales to both ⬆️ risk of #SARSCoV2 infections and ⬇️ access to timely, affordable medical care (#vaccines #primarycare #PedsICU).
17/25
Racial/ethnic disparities in #COVID19 mortality among kids arise from #structuralracism operating at multiple geographic scales to both ⬆️ risk of #SARSCoV2 infections and ⬇️ access to timely, affordable medical care (#vaccines #primarycare #PedsICU).

26-AUG-22 UPDATE
18/25
Our paper "COVID-19 and the Working Class: Harm, Resistance, and Solidarity in the United States" explores theory and praxis at the intersection of social class and structural racism.
@JanelleMMenard @BexzieGarcia
osf.io/preprints/soca…
18/25
Our paper "COVID-19 and the Working Class: Harm, Resistance, and Solidarity in the United States" explores theory and praxis at the intersection of social class and structural racism.
@JanelleMMenard @BexzieGarcia
osf.io/preprints/soca…
26-AUG-22 UPDATE
19/25
We empirically investigated the joint effects of race/ethnicity and socioeconomic position on non-elderly adult #COVID19 mortality. The majority of 🇺🇸 Indigenous, Black, and Hispanic kids have working class parents.
mdpi.com/1660-4601/19/9…
19/25
We empirically investigated the joint effects of race/ethnicity and socioeconomic position on non-elderly adult #COVID19 mortality. The majority of 🇺🇸 Indigenous, Black, and Hispanic kids have working class parents.
mdpi.com/1660-4601/19/9…
26-AUG-22 UPDATE
20/25
New 🧵 on #COVID19 disparities, deaths, hospitalizations, cases in 🇺🇸 kids - please share 🙏
@areinamo21
@Arrianna_Planey
@BexzieGarcia
@born_reddy
@BruceLesley
@ChandyJohnLab
@ChildHealthUSA
@ChomiloMD
@ChrisCarrollMD
20/25
New 🧵 on #COVID19 disparities, deaths, hospitalizations, cases in 🇺🇸 kids - please share 🙏
@areinamo21
@Arrianna_Planey
@BexzieGarcia
@born_reddy
@BruceLesley
@ChandyJohnLab
@ChildHealthUSA
@ChomiloMD
@ChrisCarrollMD
26-AUG-22 UPDATE
21/25
New 🧵 on #COVID19 disparities, deaths, hospitalizations, cases in 🇺🇸 kids - please share 🙏
@Cleavon_MD
@COVIDBLK
@DeannaMarie208
@denise_dewald
@Docsociology4
@doritmi
@Dr_ScottK
21/25
New 🧵 on #COVID19 disparities, deaths, hospitalizations, cases in 🇺🇸 kids - please share 🙏
@Cleavon_MD
@COVIDBLK
@DeannaMarie208
@denise_dewald
@Docsociology4
@doritmi
@Dr_ScottK
26-AUG-22 UPDATE
22/25
New 🧵 on #COVID19 disparities, deaths, hospitalizations, cases in 🇺🇸 kids - please share 🙏
@DrEricDing
@drkomanduri
@DrLindaMD
@DrPanMD
@DrSriram
@DrStager
@DrSteveCook
@DrTomori
@DrZoeHyde
@EllieMargolis
@ForlornTheresa
@gbosslet
22/25
New 🧵 on #COVID19 disparities, deaths, hospitalizations, cases in 🇺🇸 kids - please share 🙏
@DrEricDing
@drkomanduri
@DrLindaMD
@DrPanMD
@DrSriram
@DrStager
@DrSteveCook
@DrTomori
@DrZoeHyde
@EllieMargolis
@ForlornTheresa
@gbosslet
26-AUG-22 UPDATE
23/25
New 🧵 on #COVID19 disparities, deaths, hospitalizations, cases in 🇺🇸 kids - please share 🙏
@gradydoctor
@GYamey
@heather_haq
@JanelleMMenard
@JasonSalemi
@JennaMillerKC
@JHowardBrainMD
@jljcolorado
@JPHMPDirect
23/25
New 🧵 on #COVID19 disparities, deaths, hospitalizations, cases in 🇺🇸 kids - please share 🙏
@gradydoctor
@GYamey
@heather_haq
@JanelleMMenard
@JasonSalemi
@JennaMillerKC
@JHowardBrainMD
@jljcolorado
@JPHMPDirect
26-AUG-22 UPDATE
24/25
New 🧵 on #COVID19 disparities, deaths, hospitalizations, cases in 🇺🇸 kids - please share 🙏
@LauraMiers
@MAhealthforkids
@NicoleJacksonMD
@npdcoalition
@pccm_doc
@RheaBoydMD
24/25
New 🧵 on #COVID19 disparities, deaths, hospitalizations, cases in 🇺🇸 kids - please share 🙏
@LauraMiers
@MAhealthforkids
@NicoleJacksonMD
@npdcoalition
@pccm_doc
@RheaBoydMD
26-AUG-22 UPDATE
25/25
New 🧵 on #COVID19 disparities, deaths, hospitalizations, cases in 🇺🇸 kids - please share 🙏
@SapnaKmd
@SuzeQKnits
@TheAngryEpi
@Theresa_Chapple
@uche_blackstock
@WesElyMD
@yaneerbaryam
@yoncabulutmd
25/25
New 🧵 on #COVID19 disparities, deaths, hospitalizations, cases in 🇺🇸 kids - please share 🙏
@SapnaKmd
@SuzeQKnits
@TheAngryEpi
@Theresa_Chapple
@uche_blackstock
@WesElyMD
@yaneerbaryam
@yoncabulutmd
• • •
Missing some Tweet in this thread? You can try to
force a refresh


