Profile picture
Adam Butler @GestaltU
, 41 tweets, 9 min read Read on Twitter
Absurdly long tweet storm coming your way.

Goal is to connect the dots on the concepts in our Optimization Machine series and show why its relevant.

Currently at 38 tweets and 6 figs/tables. Will bleed it out so it's not so overwhelming.

#Optimization #RiskParity #investing
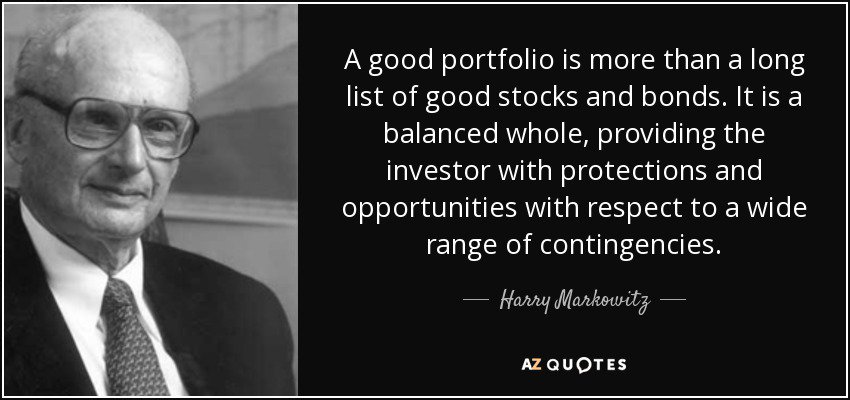
1/We’re 3 articles into a series on portfolio optimization and I’ve been challenged to distill the core themes and make it relevant for practitioners.

Here’s the TL;DR:

Portfolio construction may substantially boost performance without active views on relative returns.
2/First off here are the three articles under discussion.

Optimization Machine: investresolve.com/portfolio-opti…

Simple vs Optimal Methods: investresolve.com/blog/portfolio…

Optimization and the Sharpe Multiplier investresolve.com/blog/portfolio…
3/ Let's agree that most investors want to maximize expected return while minimizing the potential for bad luck to produce a shortfall. In other words they want the highest returns with minimal volatility.

In finance this objective is described by “mean-variance optimization”.
4/ The dominant models in finance are all rooted in this objective. For example, the (CAPM) is mean-variance optimal when market beta is the only compensated risk. Under CAPM a portfolio is MV optimal when each asset’s weight in the portfolio is proportional to its mkt beta.
5/ Thus CAPM implies that the market-cap weighted portfolio is mean-variance optimal.

A material proportion of all financial assets are held in investment vehicles and accounts that are exclusively or partially informed by market capitalization.
6/Incredibly however, MARKET BETA HAS NO RELATIONSHIP WITH STOCK RETURNS. The CAPM has absolutely no empirical merit. And top academics have known this for decades.
7/For proof look no further than Table 1 from Fama French “The Cross Section of Stock Returns” (1992) attached below. You’ll note that after controlling for size (i.e. across every row of the table) returns are independent of beta decile.
8/ Remember, the market cap weighted portfolio is only mean-variance optimal if stock returns are proportional to beta. If that condition is false – and it seems to be – then the cap weighted portfolio is sub-optimal. Indeed we show that it lags every other method that we test.
9/ This prompts the question:

If the market cap weighted portfolio is sub-optimal, WHAT IS THE ALTERNATIVE? Is the equal weight portfolio optimal? Or are there other methods that might produce better results?

This is the question that motivated us to write this article series.
10/ Importantly, we wanted to start with portfolio methods that don’t require investors to express active views about relative returns. Rather, we focused on UNBIASED methods that link expected returns to risk (similar to CAPM) or simply minimize risk.
11/ As a first step we wrote a paper describing common optimization methods and the conditions under which each optimization would produce a mean-variance optimal portfolio, summarized in the table below.
12/ We also provided a Portfolio Optimization decision tree to help investors choose the right optimization tool for the job. The example below maps the decision path to the optimal portfolio method given stock returns are independent of risk (both beta and volatility).
13/ The red arrows in the decision tree map above seek out the optimal method for a stock investor who is convinced returns are independent of risk, and who feels he can estimate covariances--> the minimum variance portfolio is MV optimal.
14/ The green arrows in the decision tree seek out the optimal method for a stock investor who is convinced returns are independent of risk, and who feels he can only estimate volatilities-->the inverse variance weighted portfolio is MV optimal.
15/ The yellow arrows in the decision tree seek out the optimal method for a stock investor who is convinced returns are independent of risk, and who feels he can estimate correlations but not volatility-->the maximum decorrelation portfolio is MV optimal.
16/ Finally, the blue arrows in the decision tree (4 tweets back) seek out the optimal method for a stock investor who is convinced returns are independent of risk, and who feels he can’t estimate correlations or volatility-->the equal weight portfolio is MV optimal.
17/ Of course the Optimization Machine can be put to use to find the most optimal allocation method for any universe of investments given investors’ assumptions about what they can estimate and how risk is related to return WITHOUT REQUIRING ANY ACTIVE VIEWS FOR RETURNS.
18/ For example, it may be reasonable to assume that broad asset classes like regional stock and bond market indexes and commodity futures have equal Sharpe ratios, in which case the maximum diversification optimization is MV optimal.
19/ It’s one thing to provide a theoretical framework for which portfolio methods SHOULD work under different conditions. It’s another to form hypotheses and put the framework to the test on live data. We put the framework to the test in article 2.
20/ We ran simulations on 10 US sectors, 25 portfolios sorted on book-to-market, 38 industries and 49 industries from Ken French’s library. We also tested on a representative universe of 12 global asset classes. All tests were run using daily total return data.
21/ We used “out-of-the-box” optimizations for walk-forward tests where we formed portfolios at the end of each quarter using different methods, with hypotheses about which method should perform best on each investment universe.
22/ For example we hypothesized that since stock returns are independent of risk, and we felt we could estimate covariances using trailing 252 days’ returns, that the minimum variance portfolio would produce the most efficient results for stock universes.
23/ Since we felt broad asset classes should have similar Sharpe ratios and we can effectively estimate covariances using trailing 252 days’ returns that the maximum diversification portfolio would produce the most efficient results for asset allocation.
24/ The table below summarizes the Sharpe ratio for walk-forward simulations run on each combination of universe and portfolio formation method.

SIMULATED RESULTS
25/ As hypothesized the minimum variance portfolio produced the best results in stock universes while the maximum diversification algorithm dominated in simulations on the multi-asset universe. The results were extremely statistically significant.
26/ The goal of the third paper in our series was to explore the fundamental reasons why optimization should produce superior results. We used a managed futures universe to help illustrate the concepts.
27/ We start by revisiting Grinold’s Fundamental Law of Active Management, which is a mathematical identity holding that investment performance is a function of skill and the square root of the breadth of active bets.
28/ Thus all things equal a manager who is able to make more diverse bets in the portfolio should be able to produce better results.
29/ Many managers mistakenly believe that they can achieve more bets by adding more securities. However, Grinold’s law only holds for UNCORRELATED bets, so it is insufficient to simply add securities. In fact in many cases more securities are unhelpful.
30/ The point of all this is that OPTIMIZATION IS THE ONLY WAY TO MAXIMIZE BREADTH. When properly formulated, the appropriate optimization should always produce better results than naïve methods because optimization produces greater breadth.
31/ The key – of course – is the condition “when properly formulated”. This is a non-trivial matter when dealing with many real-life investment problems, for example on large universes containing many highly correlated investments.
32/ However, even with out-of-the-box optimization we observe the potential to extract almost twice as much breadth (ex ante) using optimization than we are able to produce using naïve methods like equal volatility weighting.
33/ Relating this back to Grinold’s Law, if we produce 13 uncorrelated bets from optimization and just 6.85 bets from naïve weighting methods we have the potential to boost our Sharpe ratio by SQRT(13/6.85) = 1.38 or 38%!
34/ To put this in perspective, if traditional diversified managed futures strategies have Sharpe ratios of 1, at 10% target volatility this boosts a 10% expected annualized excess return strategy to a 13.8% expected return USING THE SAME TREND SIGNALS.
35/ As the ratio of the number of bets produce by optimization versus traditional naive methods fluctuates over time, so does M*. The chart below plots the evolution of this effect. Note the average Sharpe multiplier over time is 1.51 since 1988.
36/ The average Sharpe Multiplier over the past decade has been 1.77, and it averaged 1.92 over the highly interventionary period from 2008 through 2013 though it has retreated somewhat as central banks have withdrawn from their interventionary policies.
37/ To wrap up Portfolio optimization is the only way to extract the maximum amount of breadth when markets have diverse correlations. We show that optimization produces greater breadth than both traditional methods and risk parity at every time step over the past thirty years.
38/ Our analysis prompts at least one obvious question. If optimization has such great potential to improve performance, why do managers avoid it? We’ll answer it in the next article in this series, and introduce novel optimization methods for complex investment problems.
BTW thanks to @market_fox for challenging me to distill the messages in this rather nebulous article series and make them relevant. I hope I got closer to the mark today.
Missing some Tweet in this thread?
You can try to force a refresh.

Like this thread? Get email updates or save it to PDF!

Subscribe to Adam Butler
Profile picture

Get real-time email alerts when new unrolls are available from this author!

This content may be removed anytime!

Twitter may remove this content at anytime, convert it as a PDF, save and print for later use!

Try unrolling a thread yourself!

how to unroll video

1) Follow Thread Reader App on Twitter so you can easily mention us!

2) Go to a Twitter thread (series of Tweets by the same owner) and mention us with a keyword "unroll" @threadreaderapp unroll

You can practice here first or read more on our help page!

Did Thread Reader help you today?

Support us! We are indie developers!


This site is made by just three indie developers on a laptop doing marketing, support and development! Read more about the story.

Become a Premium Member and get exclusive features!

Premium member ($30.00/year)

Too expensive? Make a small donation by buying us coffee ($5) or help with server cost ($10)

Donate via Paypal Become our Patreon

Thank you for your support!