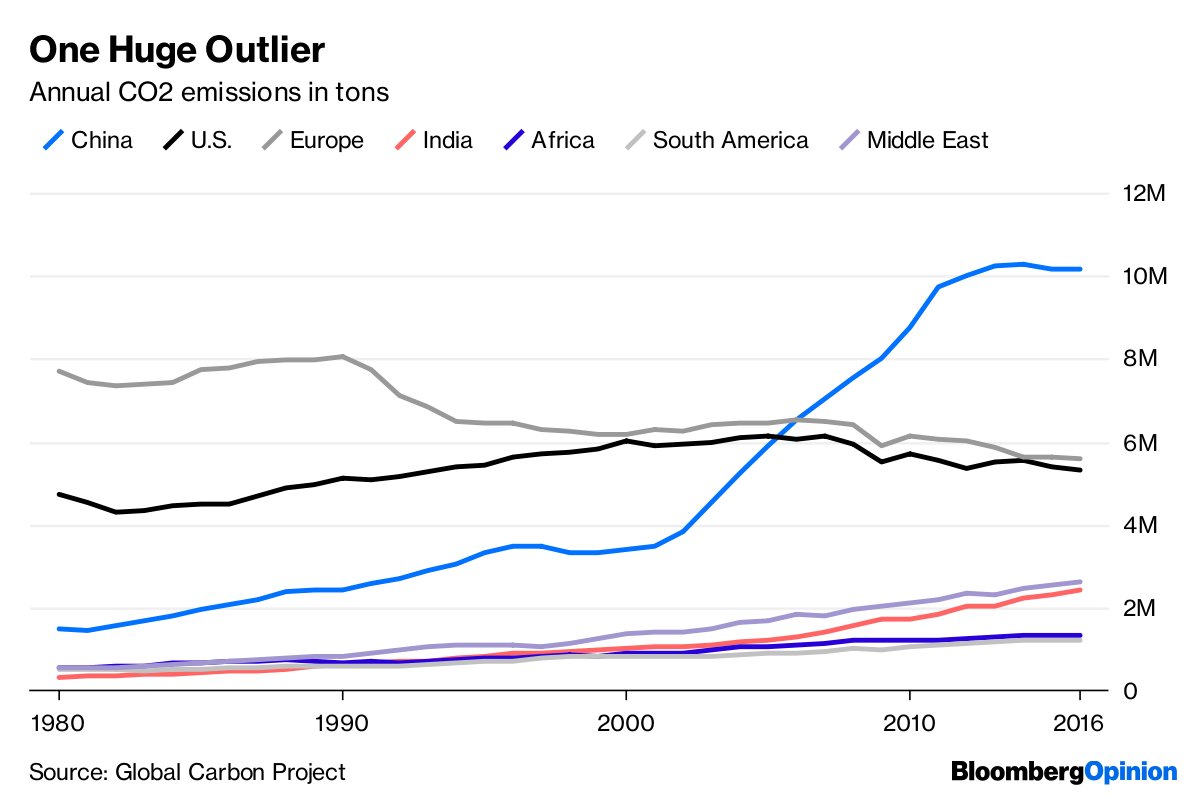
ourworldindata.org/grapher/produc…
d1tn3vj7xz9fdh.cloudfront.net/s3fs-public/fi…
d1tn3vj7xz9fdh.cloudfront.net/s3fs-public/fi…
A lot can change in a decade.

1. A mislabeled graph
2. An incomplete measure of emissions
3. Data that's over 10 years out of date
I feel justified in calling the graph "total bullshit".
(end)


