,
21 tweets,
6 min read
Read on Twitter
1/ Last week, I taught my undergrads about logit models.
Though logits are fundamental to many modern statistical techniques, where did it come from? We discussed that yesterday.
Turns out, like the 0.05 p-value, it's pretty arbitrary.
👇is a summary
Though logits are fundamental to many modern statistical techniques, where did it come from? We discussed that yesterday.
Turns out, like the 0.05 p-value, it's pretty arbitrary.
👇is a summary
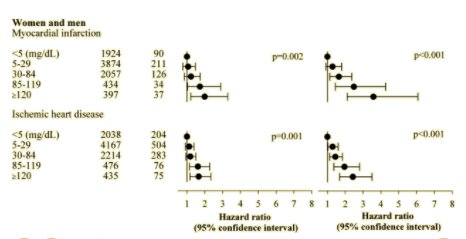
2/ To begin, here is a reminder of logit's core role in modern statistics
3/ The starting point is Thomas Malthus (yes, the same Malthus famous for "population traps") 

4/ He published his "Essay on the Principles of Population" in 1798

5/ In it, he famously discussed how population (geometrically) and food (arithmetically) grow at different rates

6/ Visually, the different rates look like this

7/ The end result is that population growth outstrips food growth.

8/ But this claim didn't sit well with some mathematicians.
Specifically, the Belgian astronomer and mathematician Adolphe Quetlete noticed that this would imply impossibly high values for population growth
Specifically, the Belgian astronomer and mathematician Adolphe Quetlete noticed that this would imply impossibly high values for population growth

9/ As editor of this journal, he put out a call for a better way of depicting population growth

10/ That call was taken up by Pierre François Verhulst, a Belgian mathematician

11/ Verhulst wrote a short paper in Quetlete's journal titled "Note on the Law of Population Growth"

12/ Verhulst starts by saying, "We know that the famous Malthus has established as a principle that the human population tends to grow in geometric progression, so as to double after a certain period, for example, every twenty-five years."

13/ He then goes on to highlight how this seems to ignore the obstacles to the "indefinite growth of the population" and that Quetelet supposes that the rate is different than geometric.
14/ Therefore, Verhulst took up the challenge of Quetelet to offer a better solution: "I thought it my duty to yield to the invitation of M. Quetelet, and to deliver them to the public."

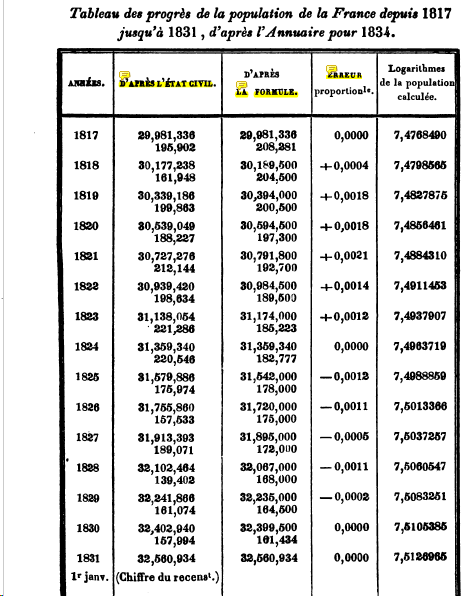
15/ At this point, he looked at population growth data for Belgium, France, Essex, and Russia from 1817 to 1833
16/ He then "hypothesized" and "assumed" different functional forms to find an equation that would start low, take off, and then start to level off (the pattern he noticed in the population data for these countries)

17/ The function looked like this:

18/ Solving for p, he obtained:

19/ That's it! In 1845, he would then publish a visual of the functional form

20/ Which looks very similar to how we draw the logit function today

21/ So the logit function, like the p-value or even the normal distribution, did not come from some profound deduction based on axiomatic first principles -- it came from guessing via trial-and-error.
Such is the way of SCIENCE!
(end)
Such is the way of SCIENCE!
(end)