,
20 tweets,
6 min read
Read on Twitter
I'm excited to show off something I've been working on for a few months now: the materials from a new class that I pinpoints a very different, and I think very promising way of teaching undergrad econometrics (thread)
I have two big problems with the way econometrics is taught. Like @metrics52 I think we focus too little on the what we actually spend all our time doing: research design and causality. We get seniors who know how to do a White test but not how to design an analysis.
Second, we lump everything together. In micro, you teach concepts in intro, and then heavier models in intermediate. In econometrics you try to teach programming, probability, statistical assumptions, hypothesis testing, regression, all at once. Impossible to follow.
So, my class that goes at the *beginning* of the econometrics sequence, and focuses entirely on two things: statistical programming, and causal inference/research design. That's it.
Everything else is booted. Focus on this now. You can do regression later, you can do hypothesis tests later, you can worry about distributional assumptions later. For now, care only about how to manipulate and summarize data, and how to evaluate and create a research design.
How do you teach research design to students who have never seen a regression? Causal diagrams, aka DAGs. However you feel about using them in research, *oh my god have you ever TAUGHT with them??* Absolute magic. 
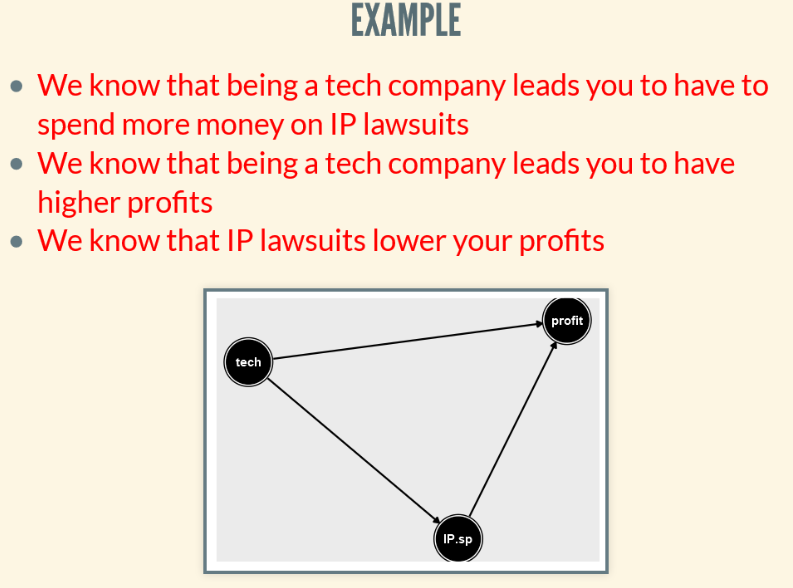
I've been using them in my senior-level classes. I get them to read empirical papers with economic models and statistical methods they don't understand, but I can have them sit down and, on their own, draw the dag and critically evaluate the paper's identification.
And they can do it. It's astounding to see students actually able to connect economic theory to empirical testing and causal identification. And not only that, but to really understand the concept of a data-generating process and the idea that we're modeling it.
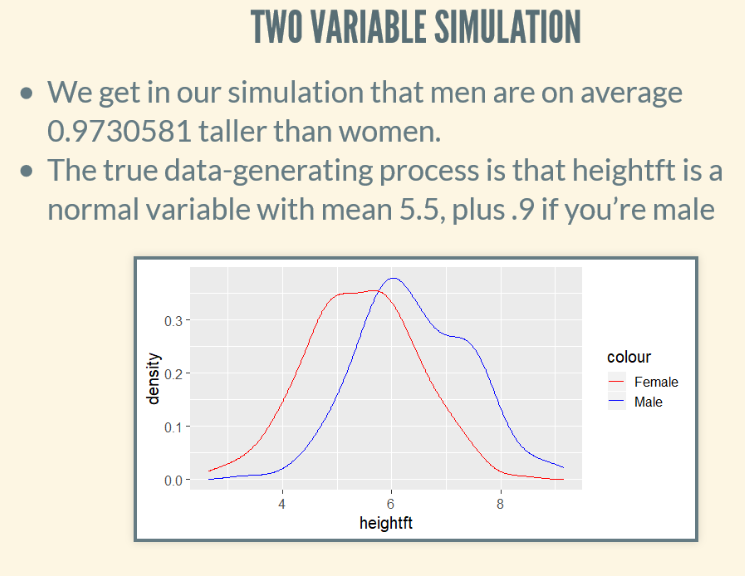
The focus on the DGP, plus the time I get to dedicate to programming, means that it makes sense to have a segment on Monte Carlo simulation, and test all our methods using it. It makes a lot of sense to do when you have a solid handle on the concept of a DGP.
Ok, so they can model the data-generating process, and I can have them look for the data-generating processes that allow for toolbox methods RDD, IV, DID, FE. But how do you do that without regression?
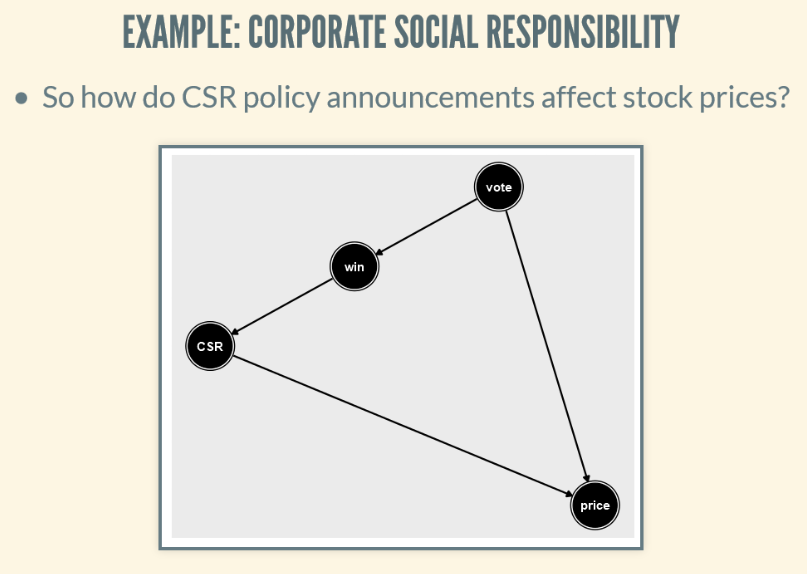
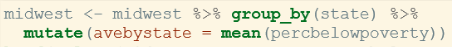
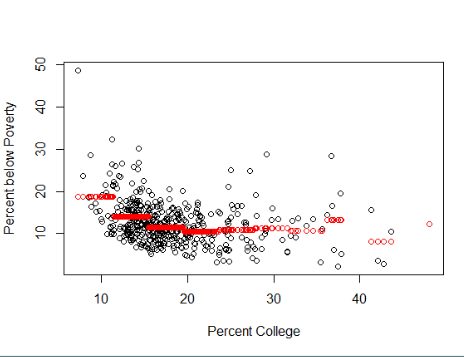
Easy. Regression is just one way of explaining one variable with another. Here's another. Means within groups. Or means within bins. You can do it with yer own two hands rather than relying on what is, for most, a black box.

This is actually what I created those animated graphs all of you are following me for. Not a mistake that none of them use regression.
Not only does this let me leave all the whole business of explaining line-fitting, slopes, coefficients, BLUE, etc., for another class where it now has more room to breathe, it demystifies regression - it's just one way of using X to predict Y.
Doing this without regression first serves to demystify the process. If you can do it by hand, it makes regression much less magical. It makes clear that what we're doing is taking an economic model and manipulating data to express that model.
I suspect talking about regression early makes it feel like a solution to problems it's not. I think this is one reason you see capstone projects with kitchen-sink regressions, or thinking that logit solves endogeneity, or running lots of robustness tests but not knowing why.
I'm talking more about the causal inference side because that's more unusual, this early, but the programming bit is cool too. R with a heavy dplyr component - the job market is favoring R heavily for our students (or Python or SAS but we're not doing that).
So that's the class. I'm sure other metrics profs have similar goals but I think you'll agree the approach is new. CI and programming (1) first, and (2) exclusively. Plus standards like simplified replications, evaluating causal claims in the news, designing a research project.
Anyway, I think it's cool I hope you do too. Glad to have CSUF Econ behind me on making such a major change. Like, really, we're aiming this to be the required first course in the metrics sequence in a couple years. First section's being taught this fall.
You can check out the materials by either going to my website where you can see the lectures. The novel stuff really picks up around "Relationships Between Variables Part 2.": nickchk.com/econ305.html
There are also cheat sheets there. You may find the causal diagram one helpful if you've wanted to learn them at a very intro level. You can also see all the raw RMarkdown files as well on the GitHub repo. (fin) github.com/NickCH-K/intro…