,
29 tweets,
7 min read
Read on Twitter
1. So, if you liked our last story about the fastest warming parts of the U.S. – well, voila. Here’s the entire globe. washingtonpost.com/graphics/2019/… 
2. This second story in our series “2C: Beyond the Limit” is a combination of massive data work, trips down little-known corridors of the scientific literature – and far flung photography and reporting.
3. It would not have been possible without @JohnMuyskens, who ran the data on dozens of scenarios within four separate global temperature datasets, and @vanhoutenphoto, who combed the beaches near the Uruguay-Brazil border for some of the shots you will see here.
4. It also would not have been possible without a host of editors and colleagues here at the Post and an extraordinarily helpful scientific group in Uruguay centered around Omar Defeo.
5. Defeo’s voluminous research on the yellow clam and the community of fishers who pursue it – both of which have been major victim of climate change – lies at the center of our work.
6. Here are a few his studies, which were the inspiration for going to Uruguay and reporting this story. int-res.com/articles/meps_…
int-res.com/articles/meps_…
int-res.com/abstracts/meps…
int-res.com/articles/meps_…
int-res.com/abstracts/meps…
7. So, this is a story about temperature data. And it is a story about the oceans. And it is a story about clams, and the people who fish for them, and what happened when the climate changed and their fishery, and their lives, were upended.
8. First, let’s talk about the data.
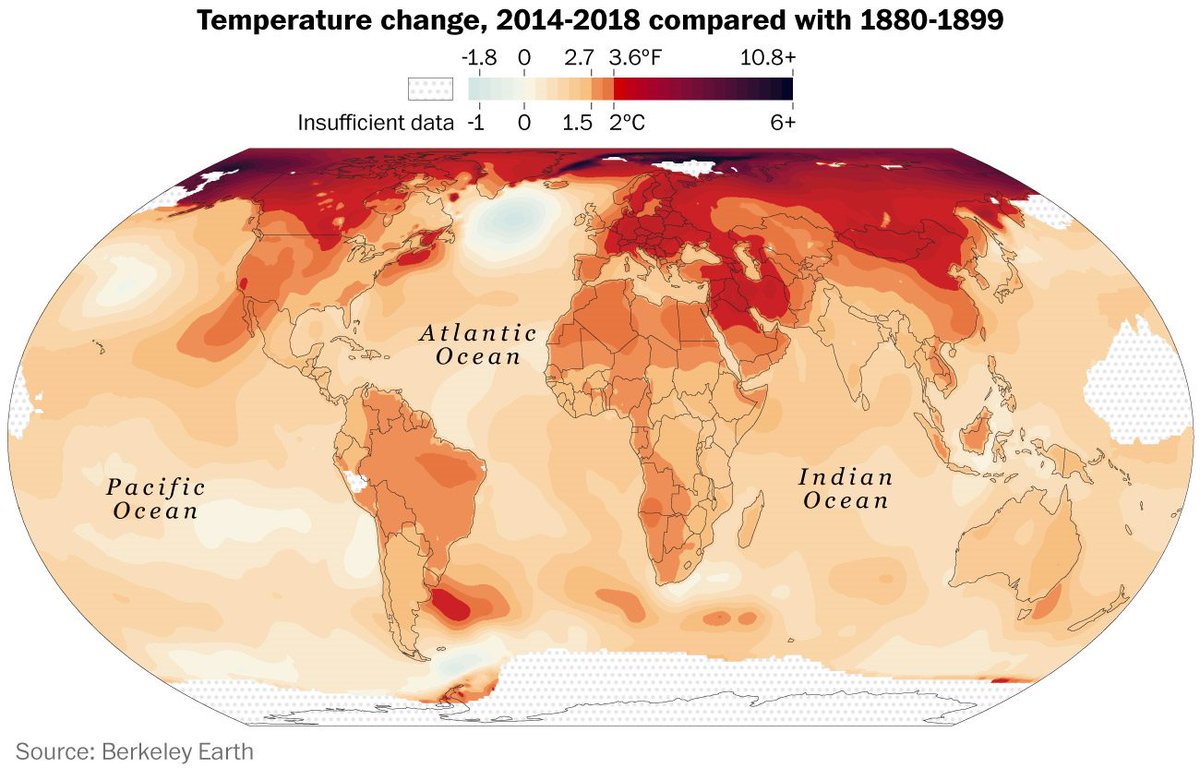
9. The gist is that it depends on which dataset you use and which time periods you analyze, but over the last five years, we found that around 10 percent of the globe has been 2C warmer than preindustrial.
10. If you prefer a 10 year period, the number shrinks somewhat. But any way you look at it, it is already a large part of the Earth, and growing.
11.We – well, @JohnMuyskens – created an animated temperature map, based on Berkeley Earth data, that shows 2C hot zones emerging using five year averages. You can see that they really expand in the most recent years
12. So pick your time period. The further back you go, the less of the Earth will be at 2C, simply because things keep getting warmer -- fast.
13. One way of interpreting this, to me, is that many of the Earth’s key hot zones are just emerging now. They are going over 2C just as the Earth itself is going over 1C.
14.And no, it is not just the Arctic. The Arctic is unique, and the warming there is very severe. But what we found is that as global warming really picks up steam, more 2C regions are appearing.
15. They are very numerous across northern hemisphere land surfaces – and they are in key parts of the oceans, too.
16. One of the most dramatic ocean hot zones is in the South Atlantic. It appears to have received very little attention, beyond the scientific literature. Yet it is one of the fastest warming ocean stretches in the world.
17. Scientists have figured out why, and it is not good news. researchgate.net/publication/25…
18.Basically the global circulation of winds is changing as the tropics expand, and so key wind-driven currents, such as the Brazil Current in the South Atlantic, are traveling to new locations.
19. In this case, this is bringing more tropical water poleward along the coast of South America – and leaving a striking hotspot, or blob, in the ocean off Uruguay and Argentina.
20. Scientists know this. They have published on it. agupubs.onlinelibrary.wiley.com/doi/full/10.10…
21. But I myself had never heard of it, and I think about climate change pretty much full time. I don’t think the word has really gotten out beyond the scientific literature.
22. That is kind of surprising since it is part of a systemic change across all of the world’s major oceans, and creates a situation that basically sets the stage for extreme climate events.
23. You have rapid ocean warming, and then you have ecosystem upheaval and an increase in dangerous ocean heat waves.
24. This kind of warming is coming for the whole global ocean, but in Uruguay, and part of Argentina, it has arrived early. (This is also true off the U.S. east coast, where the Gulf Stream region shows a very similar, and sometimes even larger, warm patch.)
25. The point is that by looking at the globe in this way – based on different regions and their temperatures – you often find big changes that have been missed. Not by scientists, but by most of the rest of us.
26. And systematic changes in ocean currents across multiple oceans is a big deal indeed.
27.In my next thread, I will explain the dramatic effects this warming is having – has already had – along the quiet beaches near Barra del Chuy, near the border between Brazil and Uruguay. For now, here’s the story itself! washingtonpost.com/graphics/2019/… /end
UPDATE -- a second thread about this story, focused on the clam fishery, has begun here
UPDATE 2 -- a third thread focusing on some countries that are already above 2C.