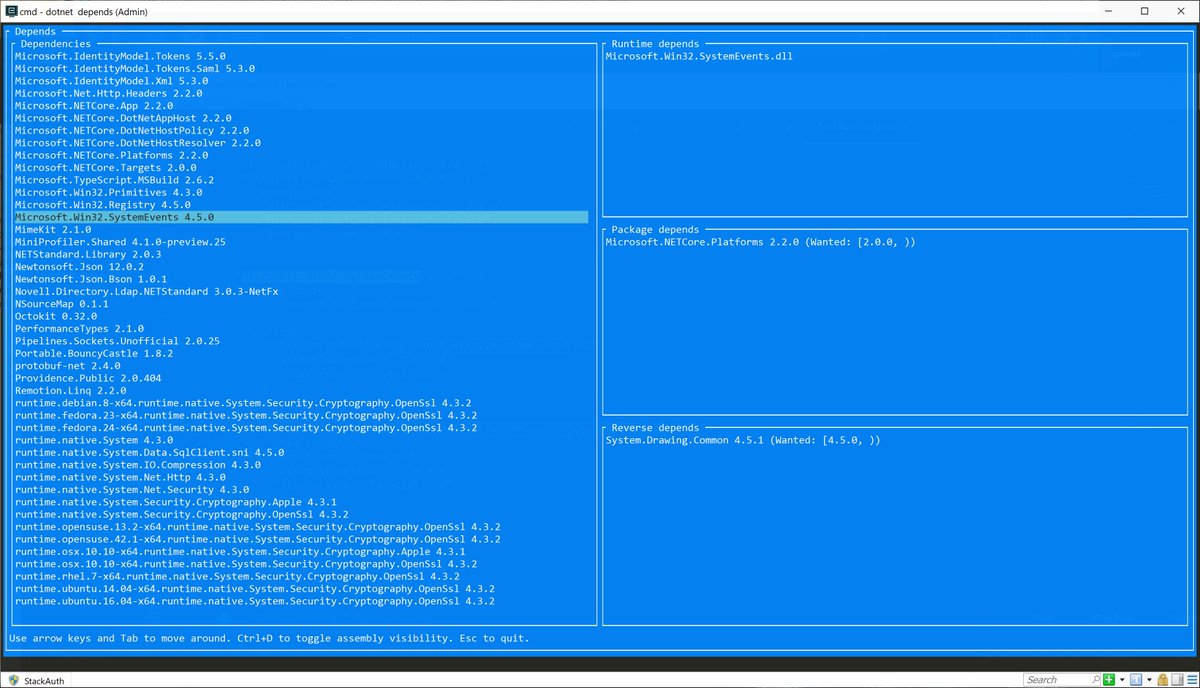
No more super lazy semi-unbounded gen 0 growth making things hard to get a read on:
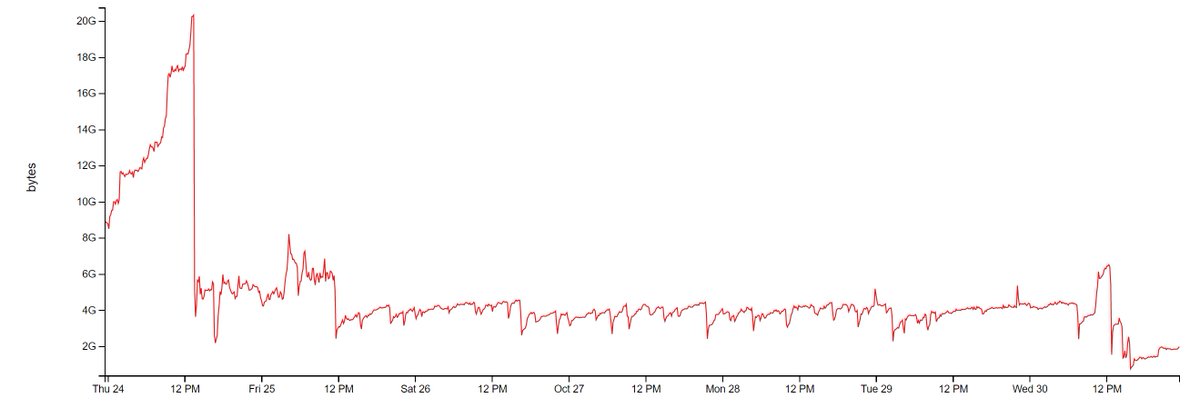
Example: we have a web tier with 64 GB. Some apps are using up to 4GB when they need a few hundred meg. Is it a bug? A leak? Or is GC just being lazy? No clue without dumps.

For environmental variables, you're prefixing with "COMPLUS_".
Note: if you want to see where they are used, you need to manually grep gc.cpp, since it's so large, GitHub doesn't index it: github.com/dotnet/coreclr…
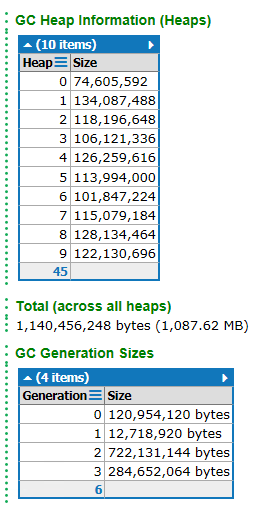
Take a memory dump (e.g. task manager) and have some fun!

