In this week’s @CambridgeIndy (6 Nov), @EdwardALeigh looks back at the Mill Rd bridge closure in Cambridge to see what the traffic sensor data tells us happened after the bridge reopened. Have traffic flows reverted to how they were before the summer holidays? Let’s see …
Starting at the Parkside end of Mill Rd, the most notable change is the large increase in cycles (over 1,300/day more). A pattern seen through all of these graphs is a weekly peak of car, and sometimes cycle, traffic on Fridays. 

East Rd is back to normal.

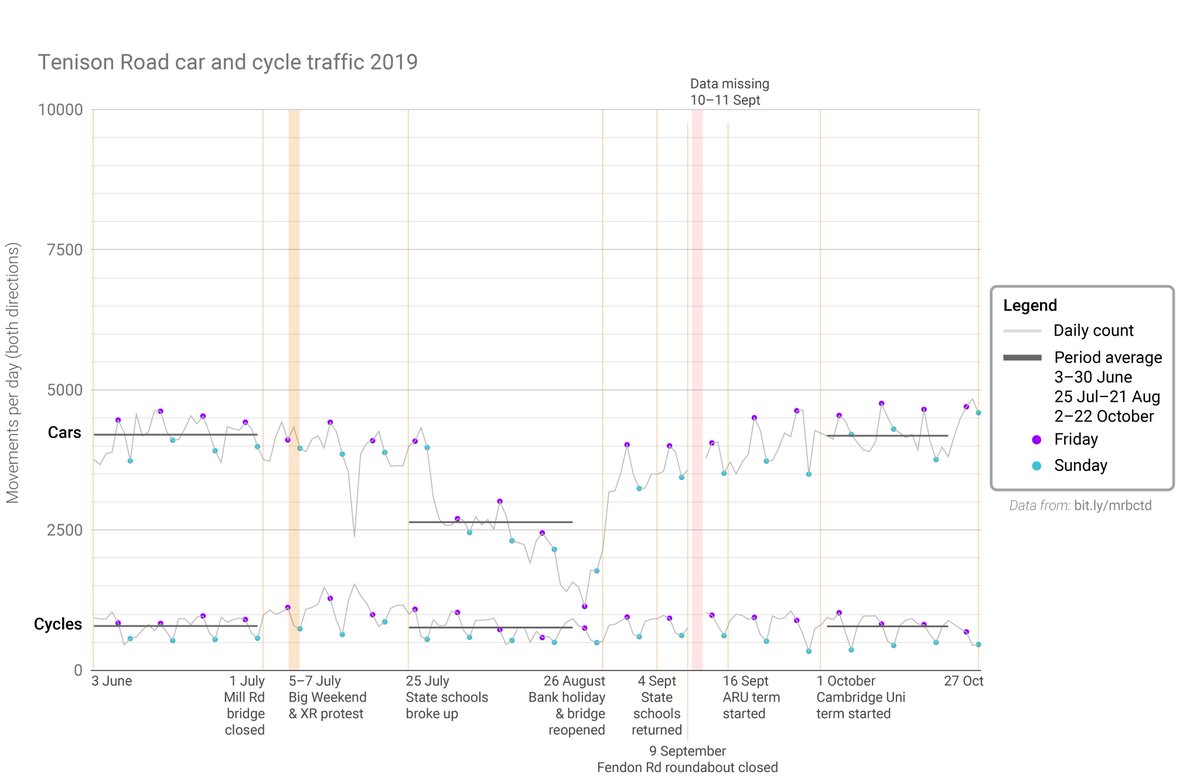
Tenison Rd is also back to normal after experiencing a steady reduction in car traffic up to the end of August.
Station Rd has seen a small fall in car traffic, probably because there are fewer tourists arriving in October compared with June.

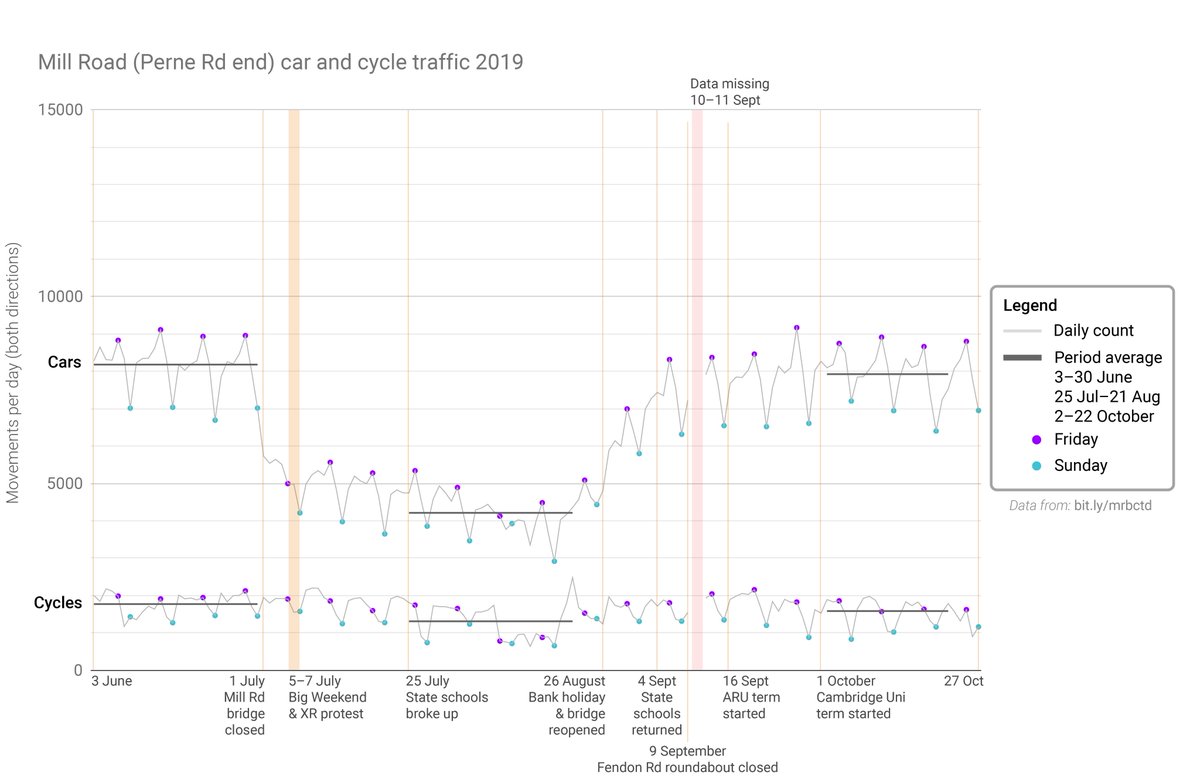
The Perne Rd end of Mill Rd has seen a significant reduction in both car (250/day) and cycle (190/day) traffic.
And on Perne Rd itself, there is a large reduction in car traffic (1,000/day). There is also a small reduction in cycles.

On Coleridge Rd, there is a modest increase in car traffic and a small decrease in cycle traffic. As it’s weekday car traffic that has mostly increased, that may indicate more commuters using this route, having discovered it during the bridge closure.

Vinery Rd has seen a small reduction in car and cycle traffic.

Car traffic over Hills Rd railway bridge is little change, but there are an additional 900 cycles/day. Are more people cycling? Or might it be that school travel patterns are different in June (exam time) compared with the beginning of the school year?

Cherry Hinton Rd has seen by far the largest sustained increase in traffic, up by 800 cars/day (7.4%). There is also a large reduction in people cycling (down by 190/day or 16%). Have those people found a safer route to cycle, or have they stopped cycling?

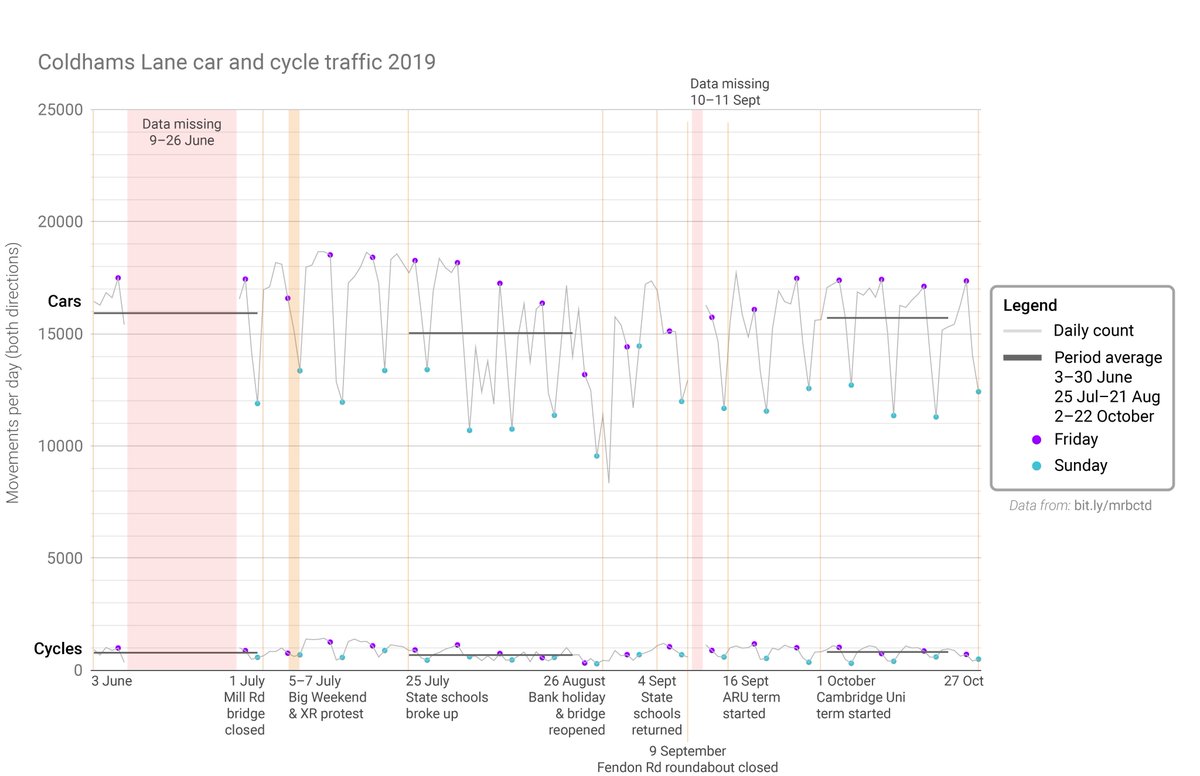
Coldhams Lane is little changed. The impact of the bridge closure is difficult to discern because of a loss of data in June, but the initial rise in traffic lasted about a month before people started taking their summer holidays.
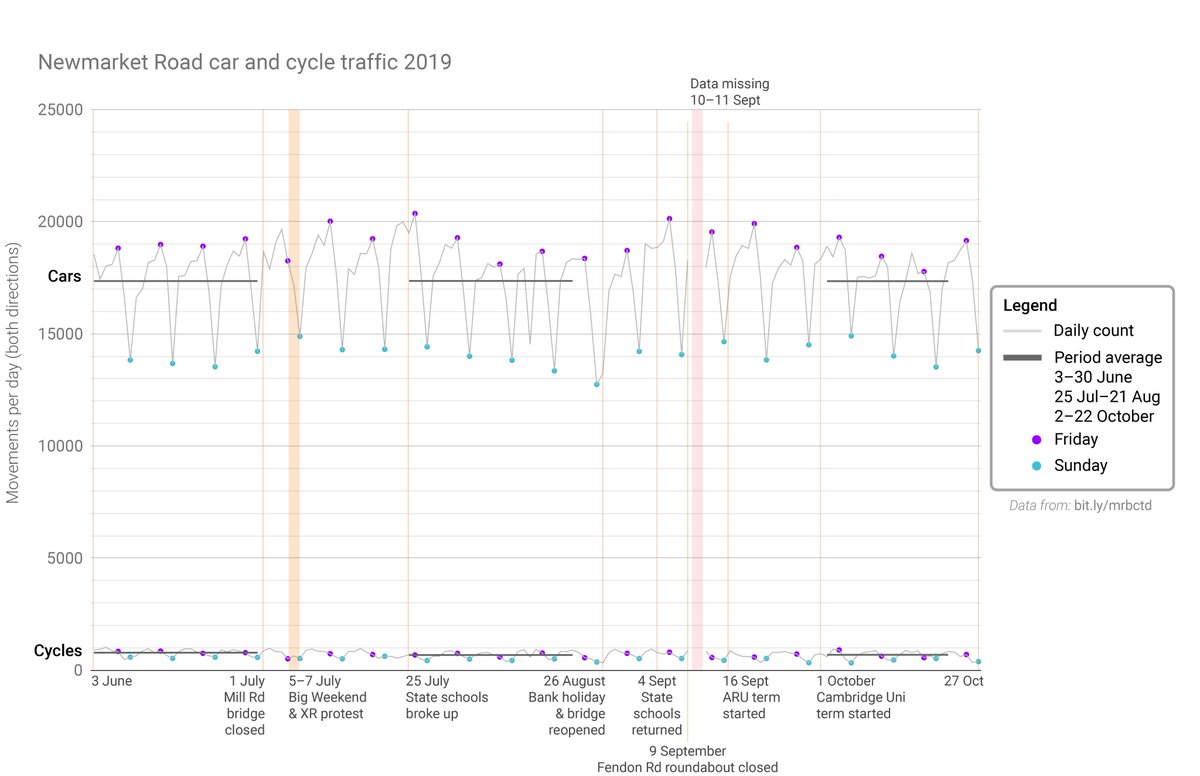
Newmarket Rd shows a similar pattern of relatively little change: a small increase in car traffic immediately after the bridge closure, falling back during the summer holidays.
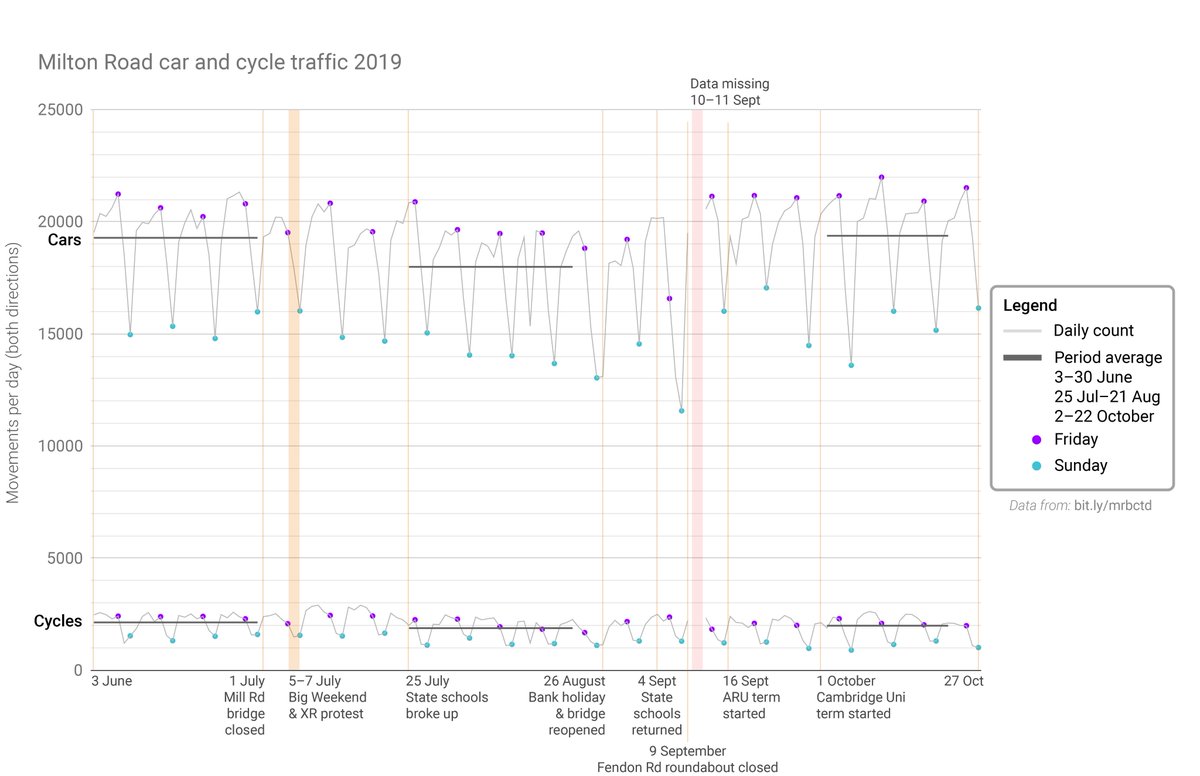
As a reference, Milton Rd traffic fell by 1,300/day (6.7%) during the summer holidays, and is now back to where it was in June. Cycle traffic has fell by 260/day (12.2%), and has not recovered to the June level: it’s still 150/day down (6.9%).
The final graph shows pedestrian and cycle traffic over Carter Bridge (Rustat Rd ↔ Devonshire Rd). An extra 500 cycle/day now compared with June, perhaps because they discovered the bridge during the road bridge closure. But why are there 350 fewer people walking over it?

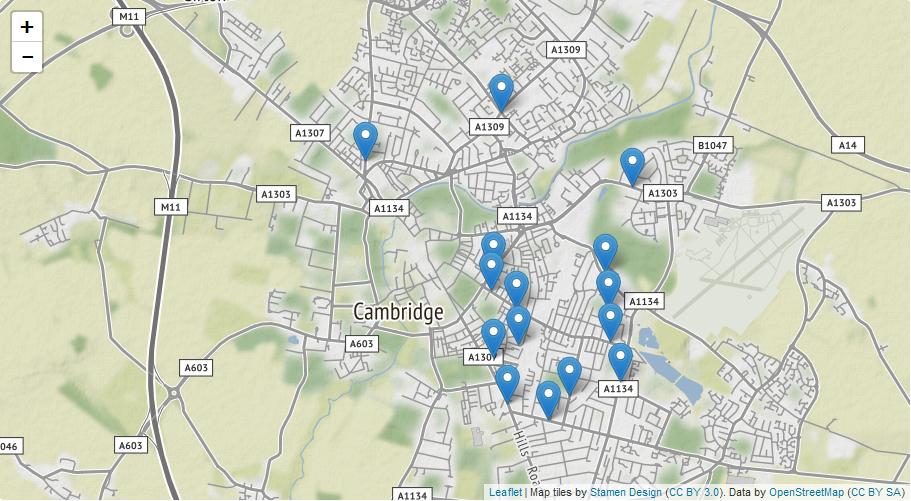
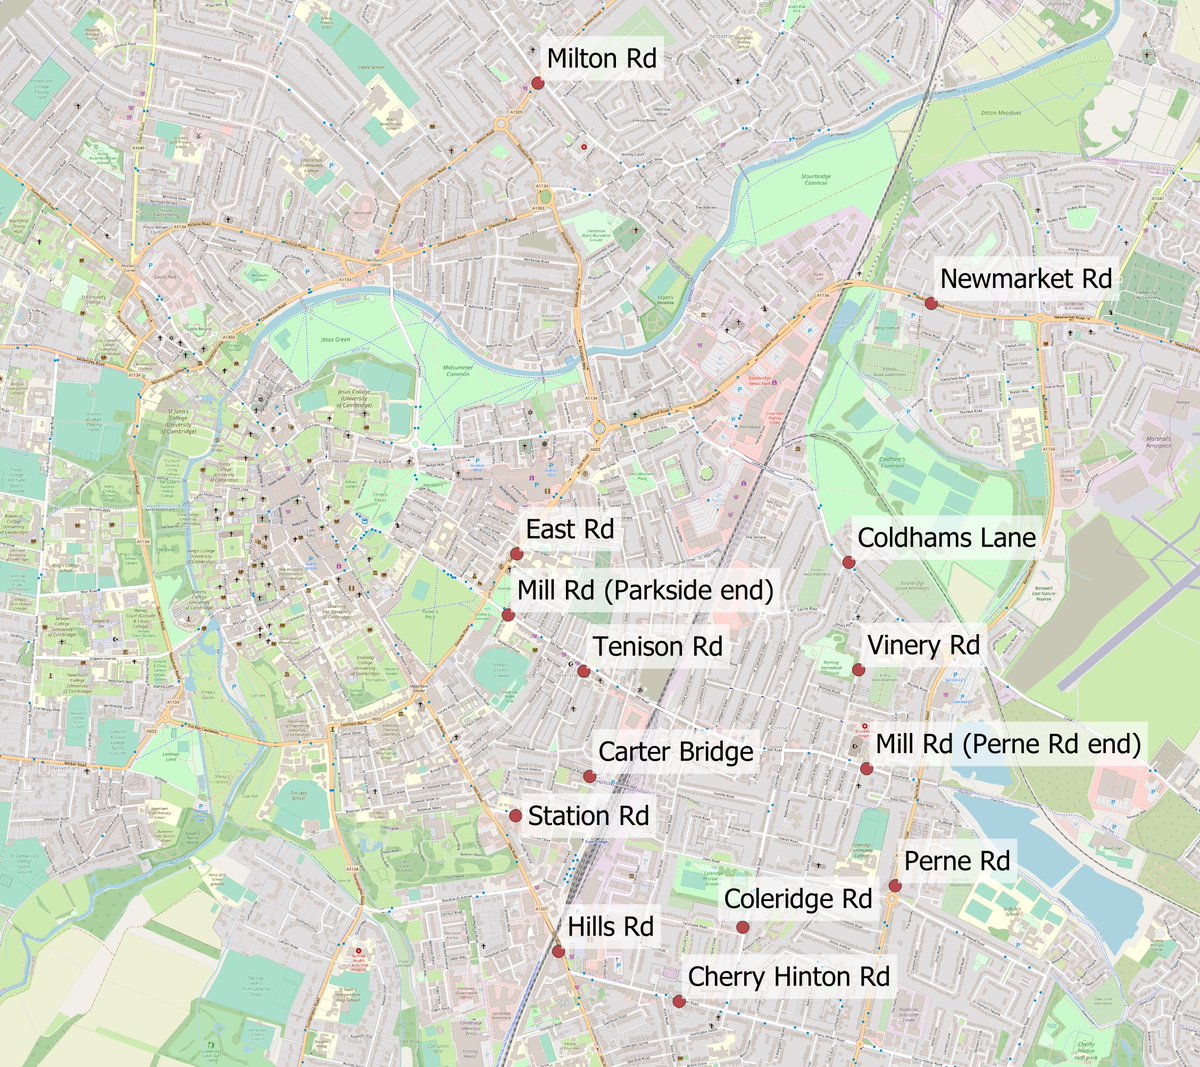
Sensor locations are marked on this map. Caveats:
1. We don’t know how accurate they are, especially when counting cycles and pedestrians.
2. We’re treating June and October as ‘normal‘ and therefore comparable. That may not be the case because of schools, tourism, weather, etc.
1. We don’t know how accurate they are, especially when counting cycles and pedestrians.
2. We’re treating June and October as ‘normal‘ and therefore comparable. That may not be the case because of schools, tourism, weather, etc.
For those curious about the Friday peaks in car traffic, this is a graph of hourly traffic counts on Mill Rd at the Perne Rd end (GVs = goods vehicles). It is clear that Friday car traffic is significantly higher than other weekdays from about 10am.