,
19 tweets,
8 min read
Read on Twitter
The story so far with the Mill Road bridge closure – in 10 pretty graphs …
@smartcamb @PhilRodgers @camcycle @MillRoadSummer @MillRoadBridges @dave4labour
@VivacityLabs visual-recognition sensors are counting motor vehicles, cycles and pedestrians at 15 locations in Cambridge:
@smartcamb @PhilRodgers @camcycle @MillRoadSummer @MillRoadBridges @dave4labour
@VivacityLabs visual-recognition sensors are counting motor vehicles, cycles and pedestrians at 15 locations in Cambridge:
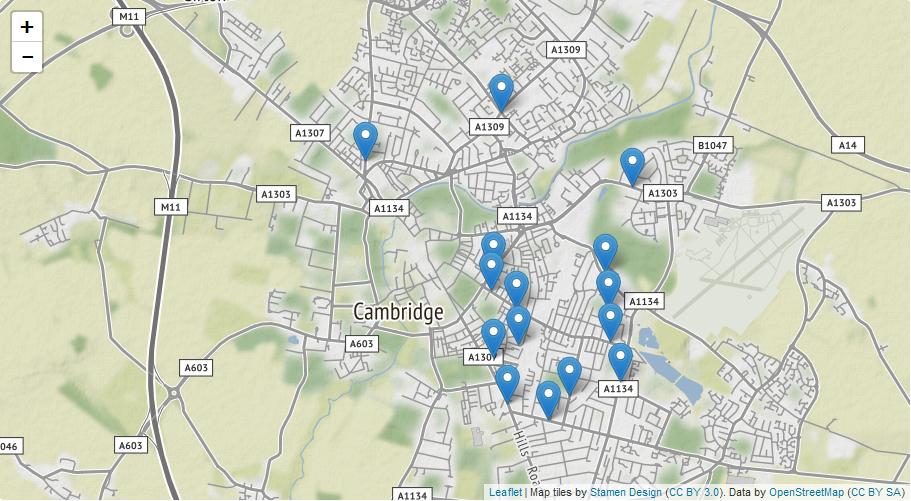
The sensors have been in place since 3 June. Mill Road bridge was closed from Monday 1 July. School term ended on 24 July. So, we’ve totalled daily counts of car and cycle traffic, and averaged over three periods: 23–30 June, 1–24 July and 25– July. Now for the graphs …
Let’s start with Mill Road itself, counted at the Parker’s Piece end. Unsurprisingly there was a big drop in car traffic (almost half or ~4,350) when the bridge closed. Cycle traffic hardly changed, but daily variability increased.

Moving on to East Road, there’s a small drop (~1,100) in car traffic, and a small increase (~400) in cycles, falling back when the school term ended.

Traffic using Mill Rd to reach East Rd typically uses Tenison Rd, so it’s not surprising to see a modest decrease (~300) in car traffic there. That was almost exactly offset by the increase in cycle traffic.

Station Road, counted at the Hills Rd end, experienced an increase (~1,000) in traffic as vehicles used alternatives to Tenison/St Barnabas/Devonshire Rd to reach east and north Cambridge. Cycle traffic shows a small increase (~250).

Now let’s look in the other direction. At the Perne Road end of Mill Road, near the new mosque, car traffic fell by almost half (~2,900). Cycle traffic hardly changed until there was a drop (~300) at the start of the school holiday.

On Hills Road, counted on the railway bridge, there was a modest increase (~850) in car traffic when the bridge closed. This doesn’t account for all the extra cars (~1,000) on Station Rd. Cycle traffic fell slightly, then further at the end of school term (~1,050 down in all).

As expected, Cherry Hinton carried most of the diverted motor traffic (~1,550 extra cars). But, recall that the drop in traffic on the east end of Mill Rd was ~2,900. Cycle traffic increased a little (~200).

Coleridge Road saw a small drop in car traffic (~150) and a smaller increase in cycle traffic (~100). Both fell significantly at the start of the school holiday (~450 cars and ~200 cycles down).

Not much changed on Perne Rd, measured south of the Mill Rd junction: a small (~100) decrease in car traffic and a similar increase in cycle traffic. What is perhaps surprising is that ~1,000 people are prepared to cycle on this inhospitable ring road.

On Carter Bridge, the cycle/pedestrian crossing of the railway between Devonshire Rd and Rustat Rd, there has been a huge increase (~1,850) in cycles, mostly diverted from Mill Rd bridge. The decrease (~150) in pedestrian crossings is likely to have switched to Mill Rd bridge.

So, to recap: large decreases in car traffic on Mill Rd (~4,350 west end, ~2,900 east end) were not simply displaced to surrounding roads. The largest increase was on Cherry Hinton Rd (~1,550). All routes other than Hills Rd saw modest increases in cycling.
@EdwardALeigh will be drawing some conclusions in his column in @CambridgeIndy next week. /END
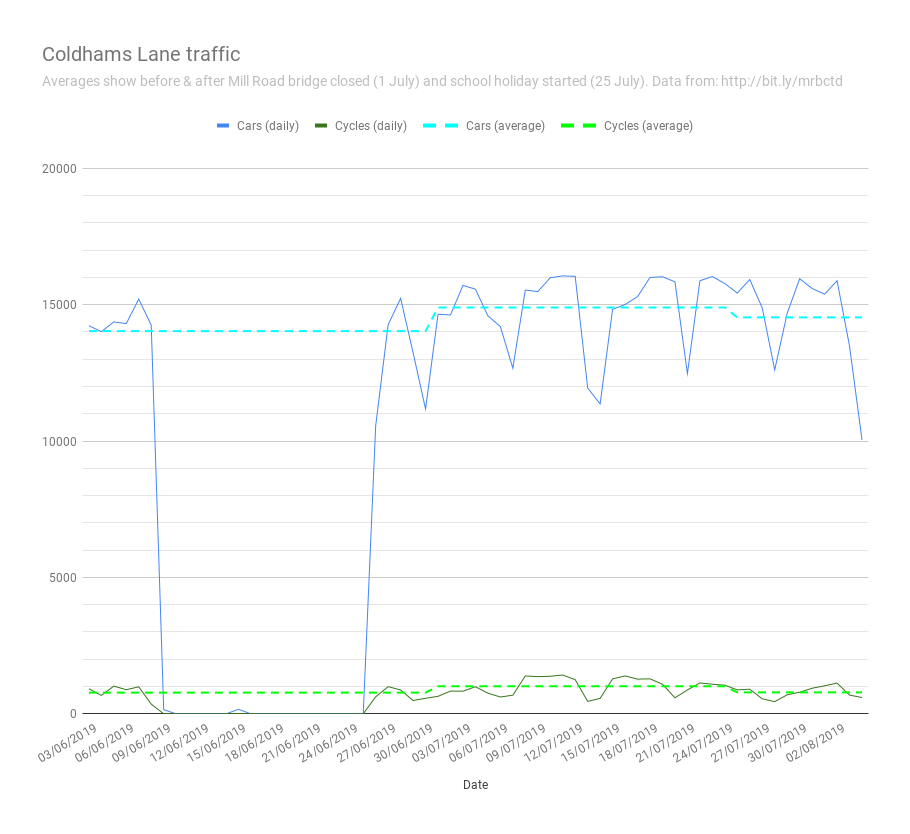
@EdwardALeigh @CambridgeIndy For completeness, this is the plot for Coldhams Lane, with the initial averages based on only the full-day counts. It shows an increase in cars of ~850 and an increase in cycles of ~250.
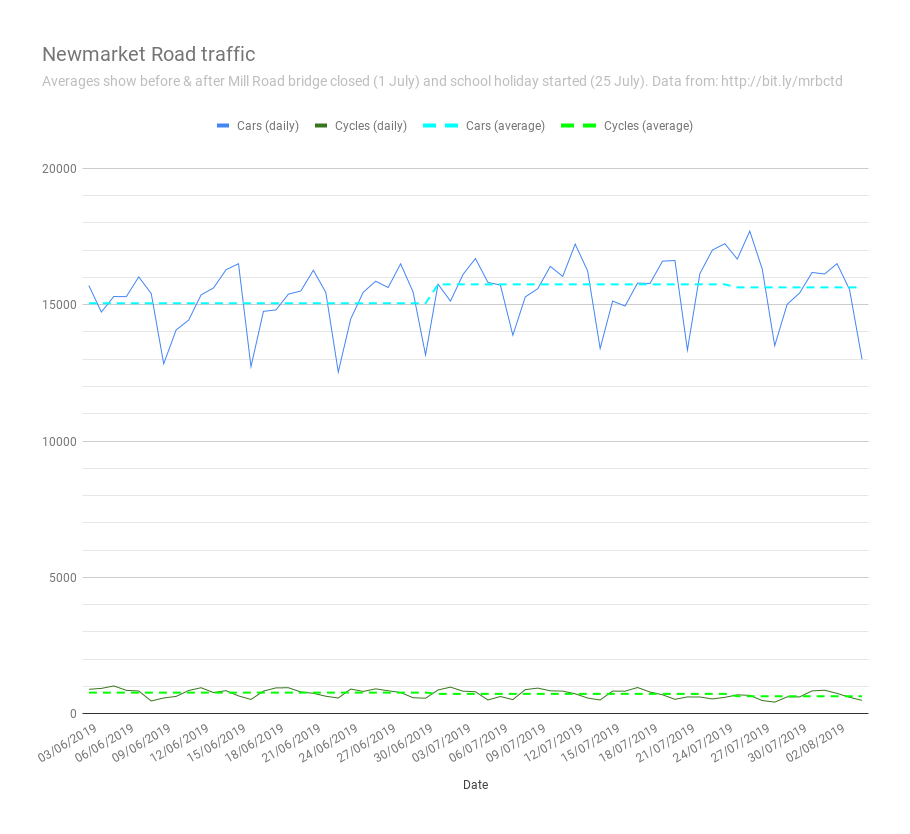
And for Newmarket Road, counted east of the Coldhams Lane junction, there was an increase in cars of ~700, and a very small decrease in cycles (~50).
If you take the total increase on Cherry Hinton Rd, Coldhams Lane and Newmarket Rd (~3,100 up), it does more or less equal the reduction in cars at the east end of Mill Rd (~2,900 down), but nowhere near the reduction at the city end (~4,350 down).
The reduction in cars on East Rd (~1,100 down) indicates that traffic was not diverting this way. Explanatory theories welcome!
This table shows the total changes in motor traffic (cars, vans, HGVs and motorbikes) and cycles. Note that the figures above are just cars and cycles, as the initial research was to look at mode shift.