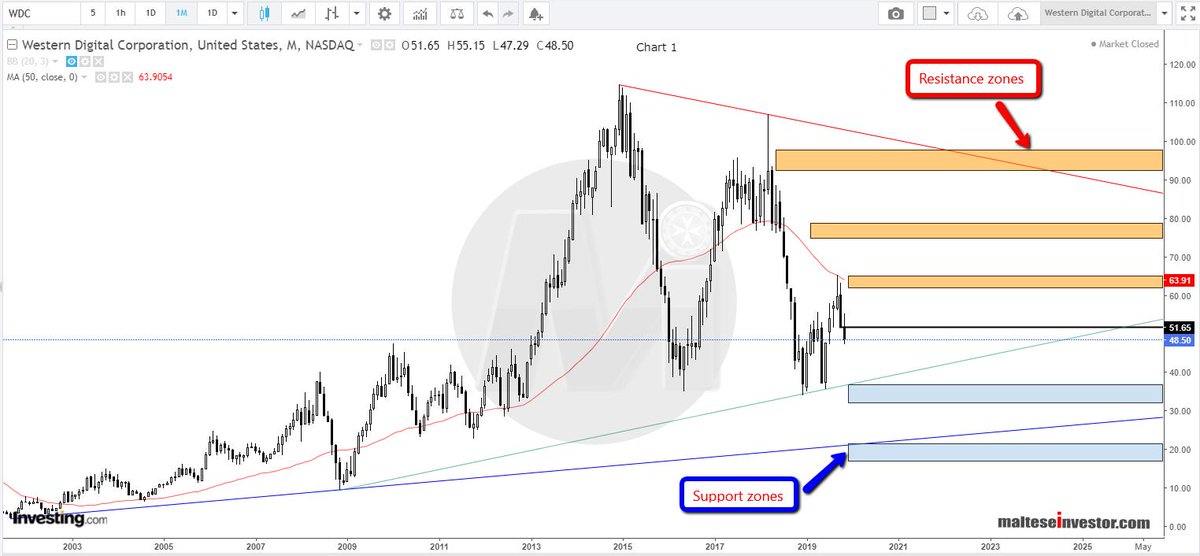
After hitting highs in Jan 2018 conditions turned messy with choppy price action in a $30 range.
JNJ 2/5
JNJ 2/5
Chart 1
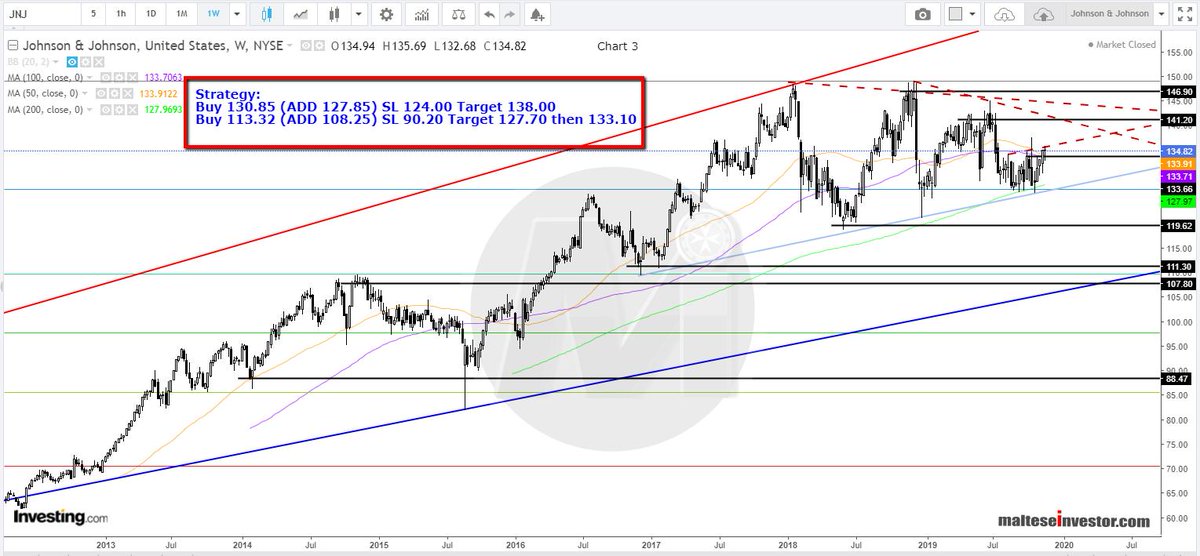
Monthly Chart: The #SMAs 100 and 50 have supported the up trend since June 2012. The SMA 50 sits below #trendline support at 125.02
JNJ 3/5
Monthly Chart: The #SMAs 100 and 50 have supported the up trend since June 2012. The SMA 50 sits below #trendline support at 125.02
JNJ 3/5
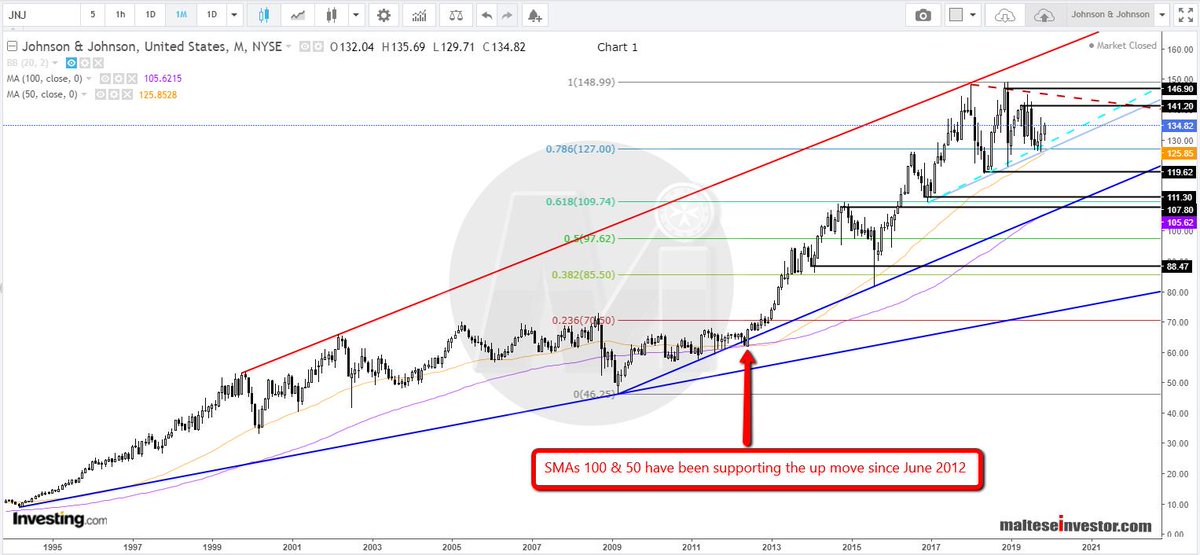
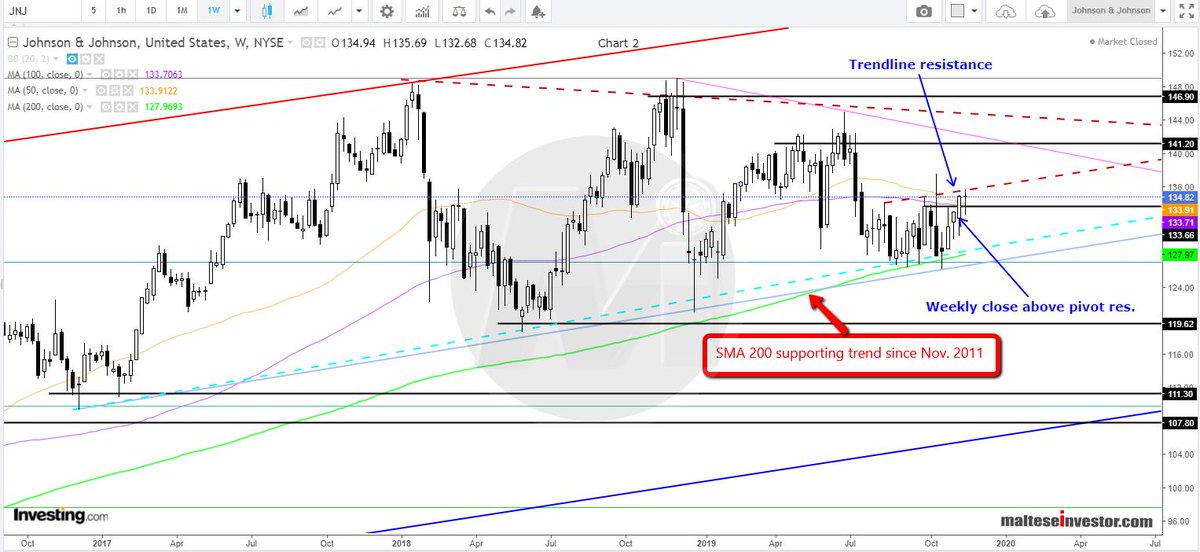
Chart 2
Weekly Chart: A close above weekly pivot resistance and the SMA 50 but trendline #resistance is visible.The SMA 200 has supported the uptrend since Nov. 2011 - currently valued at 127.96.
JNJ 4/5
Weekly Chart: A close above weekly pivot resistance and the SMA 50 but trendline #resistance is visible.The SMA 200 has supported the uptrend since Nov. 2011 - currently valued at 127.96.
JNJ 4/5