24. when I do datavis I iterate a lot and explore the space of both the data as well as the space of possible representations. mostly that means drawing a lot of small rectangles and seeing if anything pops out
25. t-sne, UMAP and dimensionality reduction will make that process much more fun and interesting
26. navigating, collecting and annotating representation spaces is a key challenge to tackle right now, as it's already a nexus for ML & vis
27. latent space isn't just for making fun morphing gifs, it gives us a new ways to talk about and work with similarity
28. don't hate on interpolation, just because a NN can't come up with something new doesn't mean it can't help us discover things we didn't know were there
29. when the NN learns a pattern we teach it, we no longer have to separate the process of expression and encoding. think animation/motion design, painstakingly editing keyframes in an interface far removed from the nature of the content
30. we can imagine interfaces that let us express ourselves and then directly utilize, modify and share those expressions
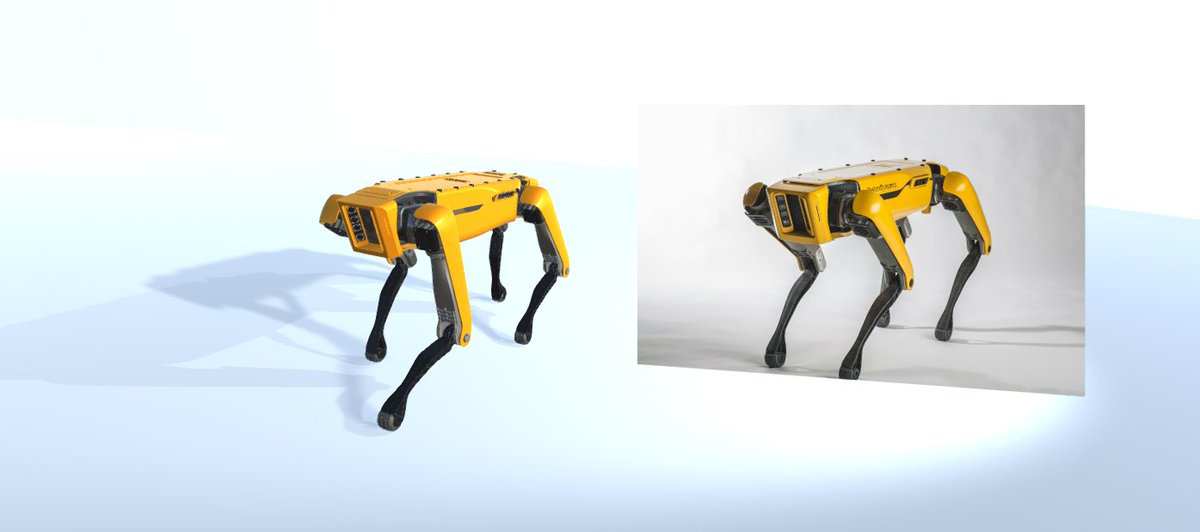
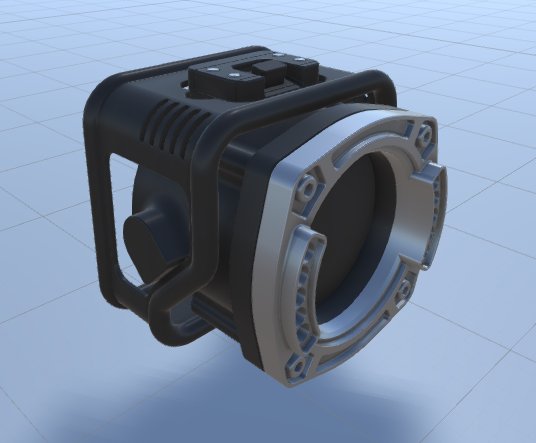
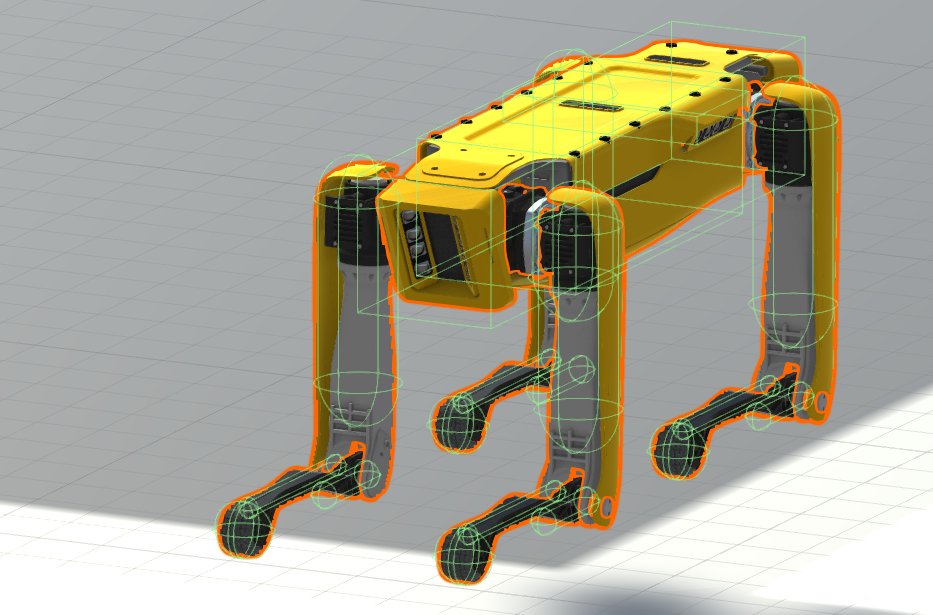
31. right now these concepts are mostly being explored in robotics, and some hints of it with posenet + dance. I'll be sharing something else related soon I hope!
32. I believe this capture & remix is necessary to make XR datavis compelling. when we have spatial representation it's too cumbersome to procedurally code camera movement in addition to coreagraphing the content in addition to incorporating gesture/movement from the user
33. speaking of gestures and users, we should be able to let people use culturally learned expressions as well as define their own. this is only possible with ML, and would greatly increase the experience space of datavis
34. when someone tells a story around a campfire they use all kinds of expressions (hands, face, volume) to create an experience. in our typical digital setting this is all discarded as people are jammed through mouse, keyboard and screens
35. this is a tragic loss, and not how it has to be. projects like @Dynamicland1 are tackling many aspects of this, even without ML at the moment. the potential for datavis is staggering
36. quick tangent on dynamicland, they are building an entire operating system using the paper cards and projection system, about as complex a project as you can think of for traditional programming. visualization is a core principal enabling this
37. it's easy to get overwhelmed by the "sheer complexity" of something, but the architects of most systems we describe like that think of them in much smaller pieces and have intuition for how they combine and relate
38. it's tempting to want to simplify these things, many people expect a single number to represent very complex things (e.g. stock price). of course those things can matter, in fact, "what gets measured gets made"
39. but it's usually not actually how we want to understand what's going on if we want to somehow improve a system. we want to know how it works internally so we can affect it somehow
40. which brings us back to ML and objective functions. currently many interesting models are trained on some kind of loss, which is a single number. what's more interesting is what happens inside, back to those latent representations
41. how do we see that? what patterns will help us understand? what do we show and what do we hide?
42. I want to introduce a new subfield of ML+vis called "latent cartography"
which I've outlined a bit here link.medium.com/MV65AP9Xu2
and I've noticed some others doing it too (this deserves it's own thread)
which I've outlined a bit here link.medium.com/MV65AP9Xu2
and I've noticed some others doing it too (this deserves it's own thread)
43. I want to zoom in for a little bit. in both ML and datavis we tend to focus on the outcome/aggregate views📈📊. sometimes the "actionable insights" 🤮
but let's spend a few tweets thinking about individual data points
but let's spend a few tweets thinking about individual data points
44. datum, sample, row, data point. often these get left behind in our quest to scale, but I want to advocate for their individual rights.
45. People are pretty good at deriving a pattern from a small amount of data (for better or worse). it can really increase trust in your machine if someone can reproduce the pattern by looking at a few relevant samples
46. this made a huge difference when we were first developing reports at @Lever. in hiring there are a few ways you can count people, and it can be confusing either way (1 person applies to 3 jobs, easy to over count if summing all applications vs. how many applications per role)
47. in different situations people care about different ways of counting, so we made sure to ALWAYS show the underlying data points that we were counting up in our charts (in table format below). that way people could trace what we were doing for them
48. we were using very simple algorithms of course, so letting people reproduce was also straightforward. with ML I think a key tool will be similarity
49. showing a small subset of similar datapoints could go a long way in helping people understand what's going on. letting people ask the model how similar it thinks two things are could go further
50. similarity feels like a very subjective notion. your idea of how similar two puppies look might differ from mine. the model might think blueberry muffins look like puppies. when we work with data points we can anchor the conversation and decide how to handle those differences
51. we have a bunch of mathematical tools to deal with similarity: topology and distance metrics are top of mind thanks to UMAP. we also have nearest neighbor search and clustering algorithms
52. UI for similarity should be a thing
(see what I did there?)
(see what I did there?)
53. subjectivity brings up the notion of perspective. we all have different perspectives on the world based on our individual experiences, but we also have shared experience and culture
54. it's possible to train many models in ways that give them different perspectives on the same data
55. there should be a visual language for tensors. some way of representing compactly the shape of a numpy array.
it takes way too much brain power to imagine it, and its both common and important that shapes match.
it's even called "shape"
it takes way too much brain power to imagine it, and its both common and important that shapes match.
it's even called "shape"
56. our tools should do more to visualize whats going on. in web world we have nice things like plugins that highlight hex codes 

57. not having to imagine what something looks like is a huge win. it lets experts focus on harder things and beginners figure out whats going on.
there should be way more emphasis on not imagining whats happening when it comes to linear algebra and hence ML
there should be way more emphasis on not imagining whats happening when it comes to linear algebra and hence ML
58. to this end I think there are a few things we can do more of. first off is iconography. we require more icons!
59. in building blocks for interpretability we came up with the idea of a semantic dictionary, where each element of an array is indexed not by an integer but a human recognizable icon.
distill.pub/2018/building-…
distill.pub/2018/building-…
60. in isolation those icons may or may not be something you can interpret, but if you have to look at the same arrays over and over, compare and contrast, then having something you mind can hold onto, i.e. something you can recognize enables whole new workflows
61. I take inspiration from video games, look at any of the big esport broadcasts: LoL, DOTA2, Starcraft2 the amount of information on the screen at any given moment is staggering. it's also very much what millions of people *want* to see so they can comprehend the game
62. data-to-ink ratio is bullshit leftover from pre-digital times. we are leaving way too many pixels on the table
63. video games prove that large amounts of information about complex dynamic systems can and must be shown. and that "the average" player will not accept and invest in learning those interfaces
64. the idea that data visualizations should be simple so people don't have to think in order to get insights is killing so many opportunities for people to get insights
65. data visualizations should *help* you think, especially things that are too hard to think about using just words, formulas or code.
66. so if what people need to do think about is complex, don't be afraid to help people handle that complexity, dont try to hide it.
67. I'm hoping augmentation doesn't become an empty buzzword, because that's exactly what we need to be doing, with both datavis and ML. give power and responsibility to your user
68. At Glassroom they had an exhibit about modern tech becoming "Big Mother" rather than Big Brother. it wants to help you, in exchange for your everlasting data. I feel this is pervasive in tech designer attitudes which leads to codling of the user.
69. data should be exchanged between consenting adults
70. join the resistance movement against averages. good place to start: always show the distribution (histograms are easy in any environment).
71. averages get worse the more dimensions you are averaging over. it's part of the Curse of Dimensionality
en.m.wikipedia.org/wiki/Curse_of_…
so the average person is a meaningless concept because people are really complex (represented by many dimensions)
en.m.wikipedia.org/wiki/Curse_of_…
so the average person is a meaningless concept because people are really complex (represented by many dimensions)
72. averages not only hide complexity, they discard almost all useful signals. in a lot of cases outliers are important to know about.
even if you don't end up showing them in your vis, you damn sure better take a look at them yourself
even if you don't end up showing them in your vis, you damn sure better take a look at them yourself
73. a lot of AI techniques involve dropping outliers and normalizing, this isn't strictly bad but we should have better ways to know what we are throwing out
74. better tools for understanding data will hopefully help, as well as better methods and building blocks. if it's easier to see more about your data you don't need to resort to averages.
75. domain experts are a key ingredient to high quality vis and machine learning. people who know the subject system(s) and have their own relationship with the data make a huge difference
76. one of the most satisfying moments in datavis for me is showing someone a visualization of data they look at all the time and hearing their excitement. especially if we did a good job and it lines up with how they imagine it
77. the real validation is when they quickly follow up by noticing something they didn't expect. that's probably my #1 measure of success. if everything is exactly what they expected they didn't need the vis to know that
78. the data is almost never exactly what anyone expects. especially for the engineers who instrument systems and scientists who run experiments. so they are great to visualize for.
79. domain experts are local guides, they can explain why something weird happens or whether a pattern is important or not. in both ML and vis you should be working with one, or become one for the data
80. collecting your own data and visualizing it is a great exercise. can you show the patterns you intuited when you were collecting? can you train a model that picks up on them?
not necessarily quantified self, any data set that interests you.
not necessarily quantified self, any data set that interests you.
81. both ML and vis are currently expensive (or perceived as such) for people who don't have the expertise. a lot of initial feedback for distill.pub was that most researchers couldn't produce vis and interaction of this caliber (no time to learn/money to hire)
82. at the same time ML seems to take a lot of compute and data, as well as a whole host of math and programming knowledge.
83. I don't think there is just one way to bring down the cost of either, but I believe we should invest in doing so as much as possible.
84. in datavis we have a massive trove of #d3js examples which are great references and lots of people learn by copy-paste. this has proven successful for even non-programmers to make creative modifications without fully understanding the technology
85. Colab is also pretty great for ML, free GPU and lots of examples to play with. I'd like to see them a bit better annotated, like @observablehq's d3 documentation.
86. more people should play with smaller datasets, transfer learning is a great gateway drug. I hope more models/tutorials are made to make transfer learning even more accessible. being able to quickly fork a model would be awesome
87. I have an almost somatic representation of vectors in my head. it's pretty visual and I should keep trying to express it. this is an early attempt
bl.ocks.org/enjalot/c1f459…
it's also about one way to compute similarity
bl.ocks.org/enjalot/c1f459…
it's also about one way to compute similarity
88. I want to be able to feel the difference between datapoints. I think it's possible on a case by case basis to make representations of high dimensional points that give you that feeling. actually I get a sense of that in a lot of @sxywu work
89. we often want the computer to tell us the difference for us. this has long been done via clustering algorithms, most famously k-means.
the problem is we don't have good interfaces to tell the computer how to feel the difference
the problem is we don't have good interfaces to tell the computer how to feel the difference
90. when you run k-means you have to tell it how many clusters you want, but how would you know before hand? you can just run it with a bunch of different choices for # of clusters and use some math to see which one is best, but this is a cumbersome work around
91. k-means, and more sophisticated clustering methods also still depend on you defining a distance metric, how to calculate how similar two data points are. how are you supposed to know that ahead of time?
92. check out this list of distance metrics implemented in UMAP
umap-learn.readthedocs.io/en/latest/para…
I've heard of 3 of them (euclidean, cosine and manhattan) and only kind of know why I'd choose between euclidean and cosine.
how do you get an intuition for that?
umap-learn.readthedocs.io/en/latest/para…
I've heard of 3 of them (euclidean, cosine and manhattan) and only kind of know why I'd choose between euclidean and cosine.
how do you get an intuition for that?
93. another thing to think about is stability of algorithms, what happens when you add new data?
should it find it's place among the existing cluster/map? or should it be able to create a new cluster if it's substantially different?
both can be legit usecases
should it find it's place among the existing cluster/map? or should it be able to create a new cluster if it's substantially different?
both can be legit usecases
94. so you got yourself some clusters, yay. the machine has told you what it thinks, how do you know if you agree? sure there are statistical methods to describe density or variety of clusters, but does that help?
this is an open problem in ML + vis
this is an open problem in ML + vis
95. what I see very smart people I respect do is throw a ton of different views at the clusters. a variety of stats and heatmaps and histograms.
also a fair bit of sampling individual data points and staring at them. this is where vis can make things much better.
also a fair bit of sampling individual data points and staring at them. this is where vis can make things much better.
96. what we really want to be able to do is zoom in and out of our data in meaningful ways. that means we have to be thoughtful about how we aggregate when we zoom out, and how we represent points when we zoom in.
97. I don't believe there is one way of doing this, or that one tool will come along and do it for everyone. it's got to be a collection of abstractions that can be customized when applied to a specific dataset.
98. I'm inspired by R's ecosystem and IDE. the tidyverse and ggplot implement great abstractions. numpy and pandas along with jupyter are also a great start for python. not matplotlib tho, it's definitely the wrong abstraction.
99. in any environment it should be easier to make a lot of slightly different versions of the same thing. in datavis we call it small multiples. ask @zanstrong :)
in ML I think they call it hyperparameter search (sounds too sci-fi...)
either way it should be a first class thing
in ML I think they call it hyperparameter search (sounds too sci-fi...)
either way it should be a first class thing
100. one of the hardest things about working with data is managing versions and naming things in a helpful way. all environments should enable you to save and name transient copies of data or code after-the-fact
101. some great folks to follow if you liked any of this thread are @ch402 @ludwigschubert @hardmaru @shancarter @zanstrong @arvindsatya1 @kcimc @nicklovescode @recifs @MaxNoichl @leland_mcinnes
I owe many links to all of their work if this turns into a blog post
I owe many links to all of their work if this turns into a blog post
whew I made it to 100 @vgr! feels like successfully cleaning out a garage and converting it into a workshop or something. glad I pushed myself.
shit I forgot to shout out @infowetrust who's book is a must read for anyone who does want to get more into #datavis
it is a fun read and will give you a more first principles approach going forward in whatever data you work with
it is a fun read and will give you a more first principles approach going forward in whatever data you work with