The Q4 burn represents the 4th consecutive quarter of growth in profits for Binance as well as represents a profit of $188m back to 2017 levels. 

Importantly, the 2,216,888 BNB represents a token retirement rate of 1.51% (tokens burnt/shares outstanding) this quarter, well above their average of 1.08% per quarter.
This pushes back against the critique of buyback and burn models not burning supply at quick rates
This pushes back against the critique of buyback and burn models not burning supply at quick rates
Though at similar levels of Revenue as 2017, Binance is a very different company than what they were two years ago. This is most clearly represented in Trading Volumes which are still well below 2017 and 2018 levels
Data from Digital Assets Data
Data from Digital Assets Data
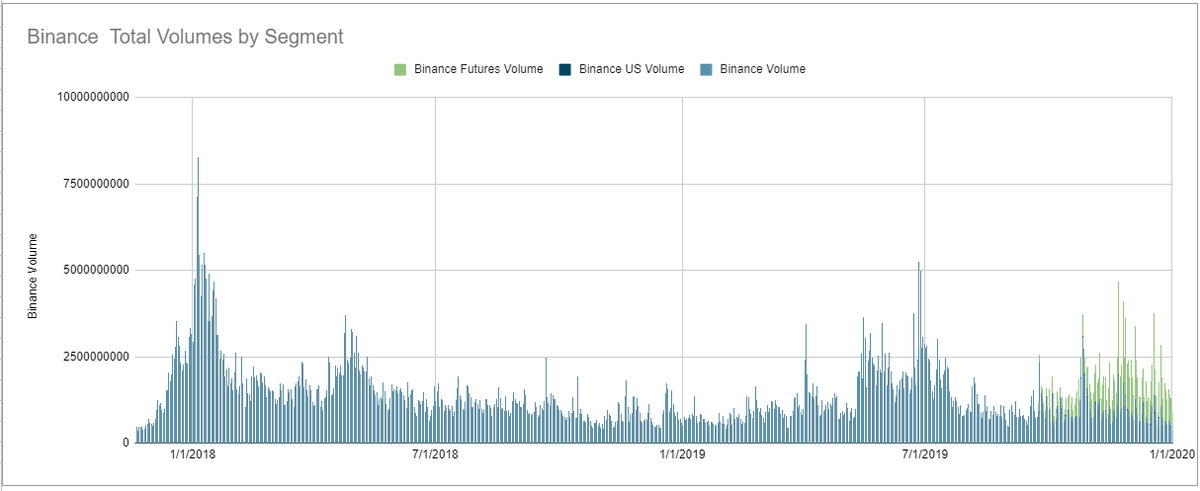
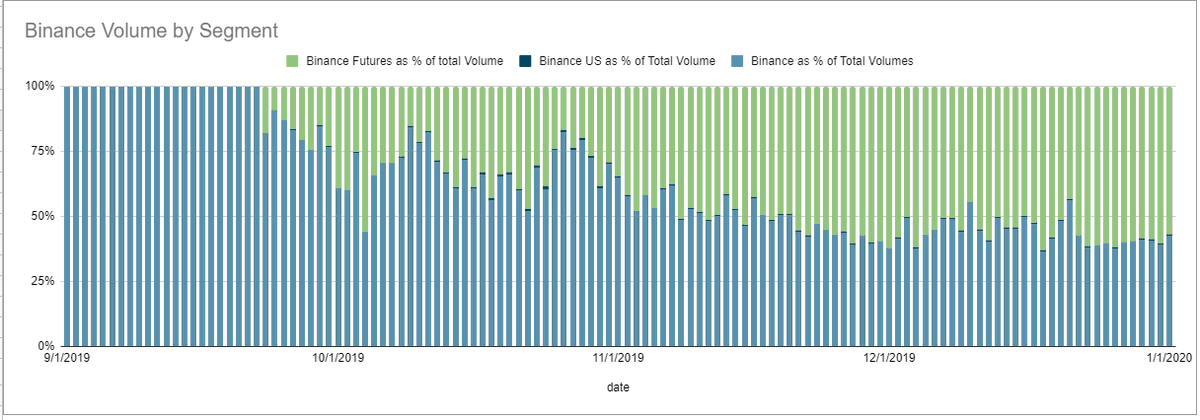
With Spot Volumes still declining, the introduction of new products such as futures have been a success for Binance.
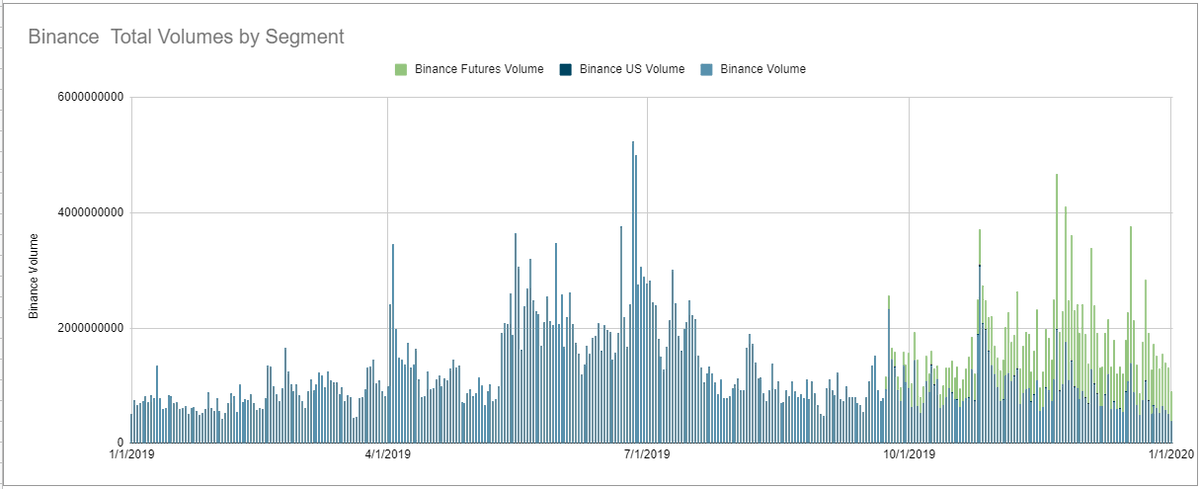
So much so that since they were introduced in September, they have often represented more volume than their spot market.
Side note: Though @BinanceAmerica volumes so early initial growth (due to no trading fees promotion) they did not have the same impact as futures.
Side note: Though @BinanceAmerica volumes so early initial growth (due to no trading fees promotion) they did not have the same impact as futures.
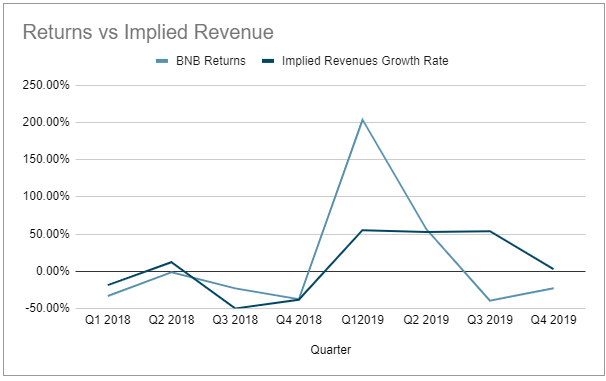
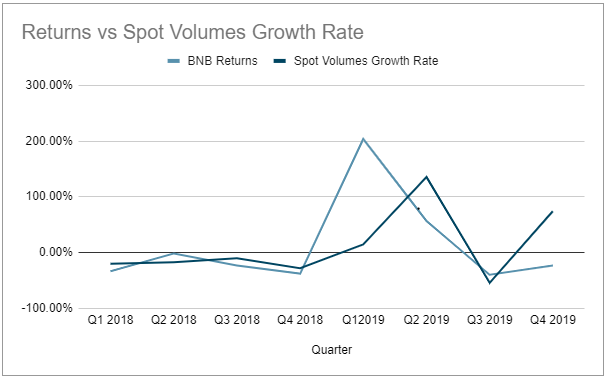
Revenues and Trading volumes are incredibly important to follow when tracking $BNB as BNB quarterly returns are highly correlated with them.
BNB and Revenues growth Corr: 0.989
BNB and Trading Volumes growth Corr: 0.791
BNB and Revenues growth Corr: 0.989
BNB and Trading Volumes growth Corr: 0.791
Though @cz_binance has stated that the revenue growth has come from Futures, I don't think that tells the full story. We can find the Average Trading Fee by dividing the Implied Rev by Trading Volumes.
As we can see the implied avg trading fee has increased the last 2 quarters
As we can see the implied avg trading fee has increased the last 2 quarters
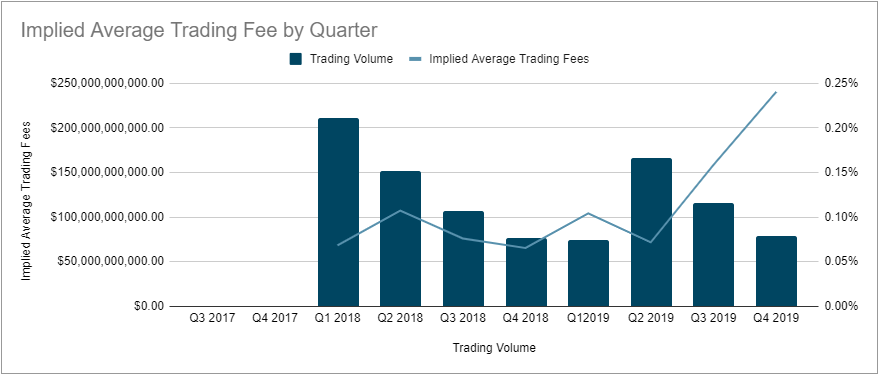
We can make some assumptions about this.
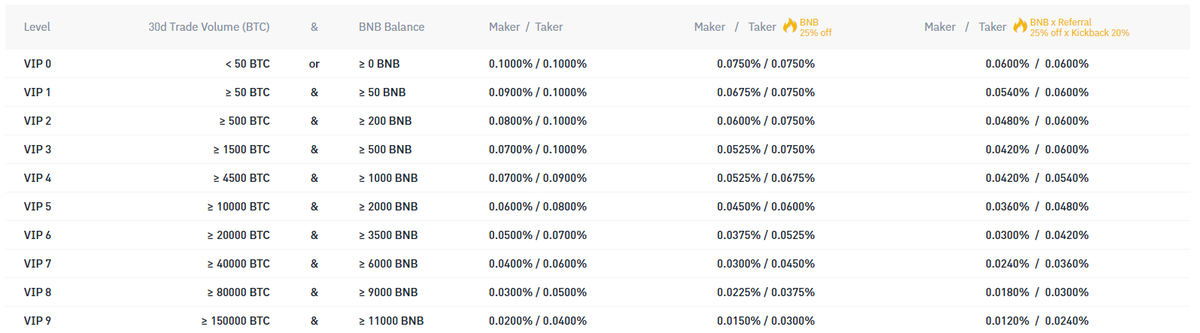
Due to Binance's fee tiers, we can assume that the amount of smaller traders who don't qualify for fee discounts has increased.
Note: This is an imperfect analysis as it does not subtract rev from OTC, IEO's, ect.
(source: binance)
Due to Binance's fee tiers, we can assume that the amount of smaller traders who don't qualify for fee discounts has increased.
Note: This is an imperfect analysis as it does not subtract rev from OTC, IEO's, ect.
(source: binance)
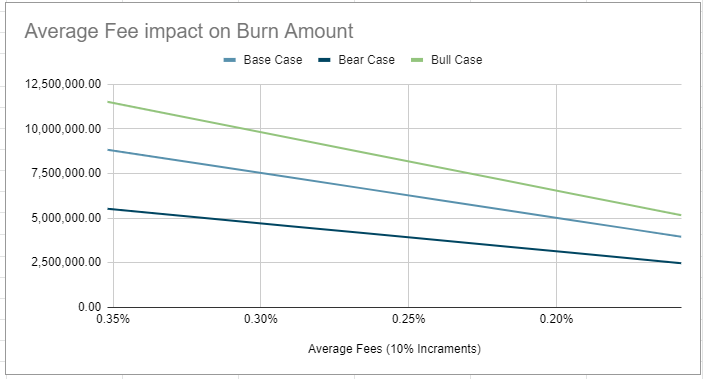
Using sensitivity analysis we can analyze how different implied avg fee impacts revenues and thus impacts burn amounts.
Note: This is annualized and the three scenarios are based on different growth rates in trading volumes.
Note: This is annualized and the three scenarios are based on different growth rates in trading volumes.
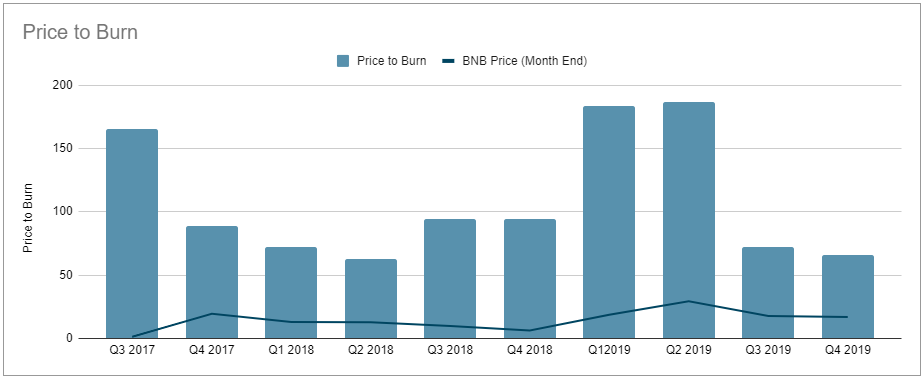
To wrap this up, we can use the disclosed burns to create multiples similar to a Price to Earnings by comparing the price to burn per share. The current PB ratio is 66.30 well below the average of 108.67.
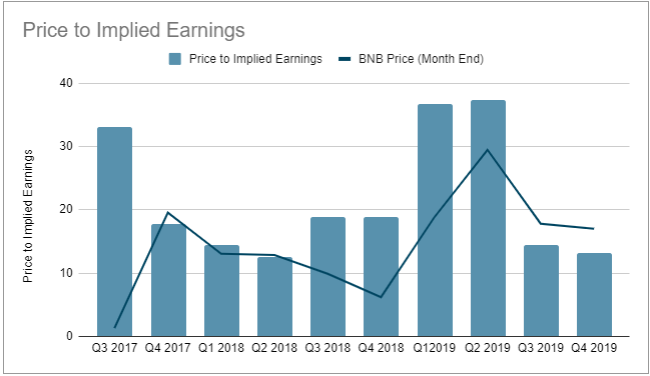
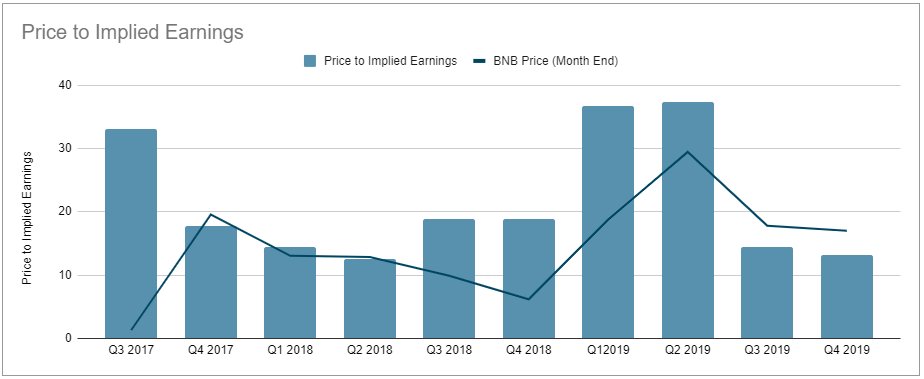
Similarly, we can create a Price to Implied Earnings ratio.
Current: 13.26
Average: 21.73
Current: 13.26
Average: 21.73
To conclude even without 10ks we can take @binance burns and learn a great deal about the overall health of the company.
Disclosure: Arca holds a position in BNB