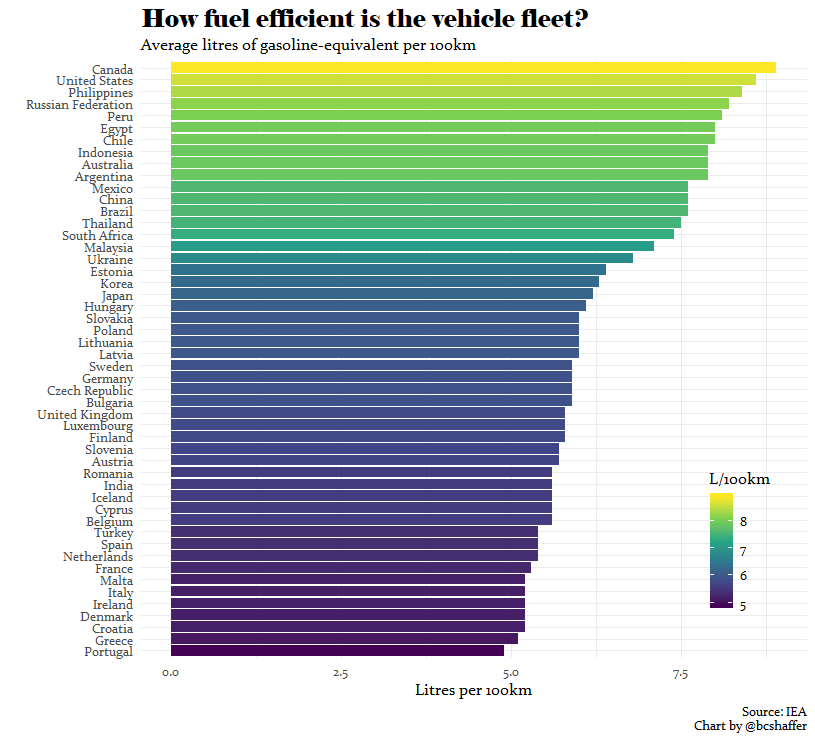
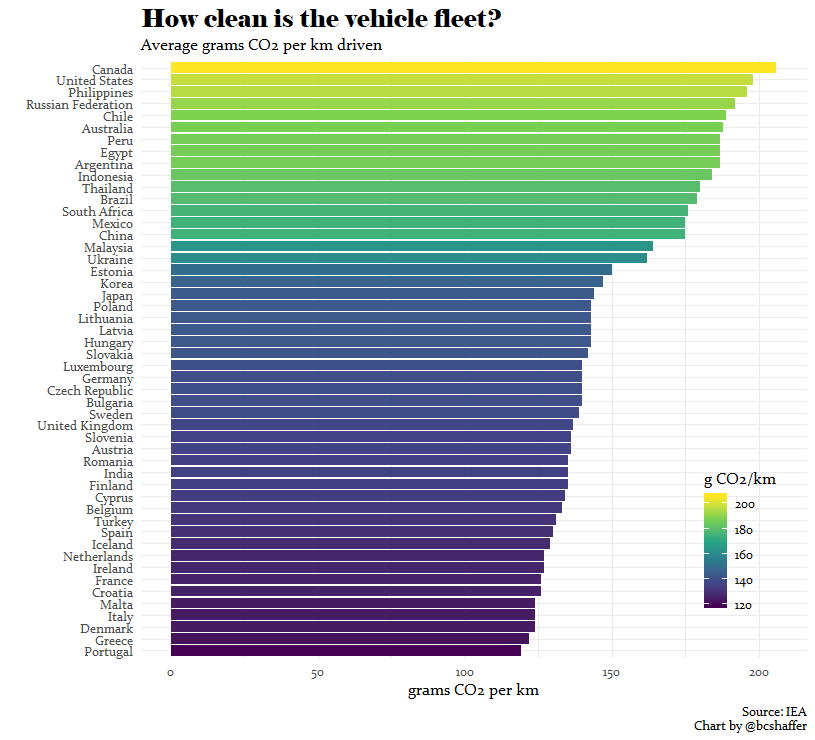
"The average adult man differs from the average adult woman in a number of respects. Average height is taller..."
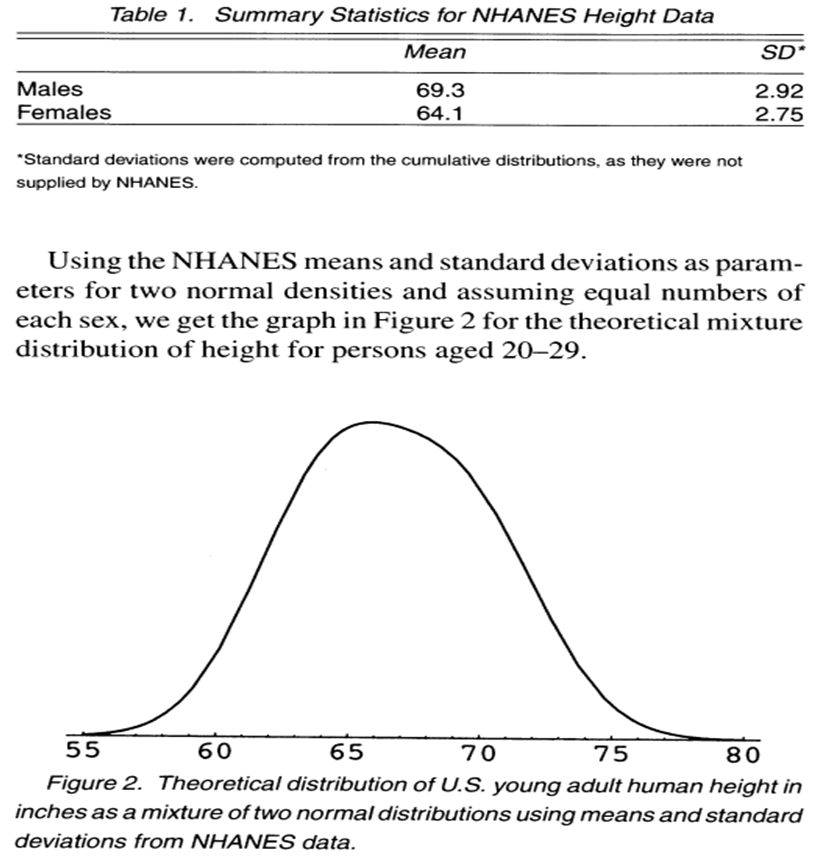
Again, true. But again, I doubt sampling the population as a whole would reveal a bimodal distribution. Only disaggregation by sex allows us to understand that we have two overlapping populations.
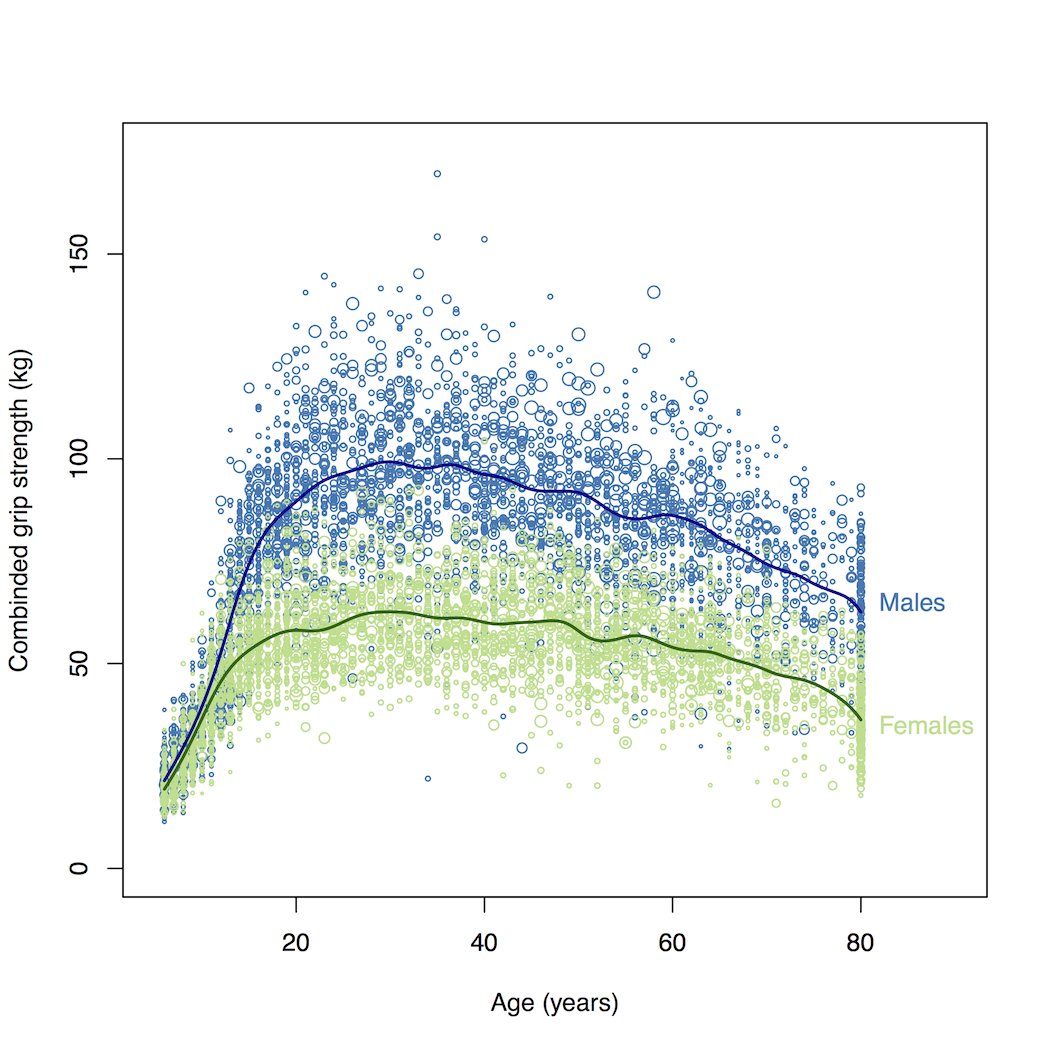
If there were no male/female separation of colour and no mean lines, you really think grip strength would be bimodal across the population?
Plotting secondary characteristics as if they were able to predictively discriminate the sex of someone is arse backwards.
What features might we use?
The graph is coloured by sex, but even if it weren't, it's obvious that it's a bimodal distribution.
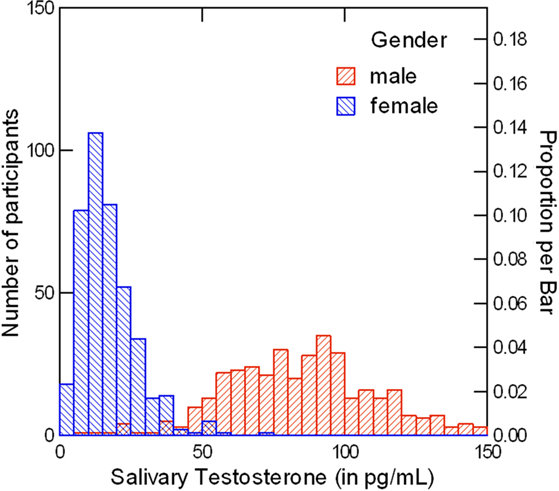
What might the discrete categories/groups be?
What discrete category division underpins testosterone level?
"People with small gametes".
Work down to basic principles, you'll see how from that basic principle all of your starbursts explode.


