My Authors
Read all threads
$XAO 2H chart. I don't trade this so why bother to chart it? For me it's a sentiment indicator or (tide) gauge to help decide when I should or should not take trade setups. I want the downtrend broken (1) and then (2) my sentiment lies where price settles in the S-R zones
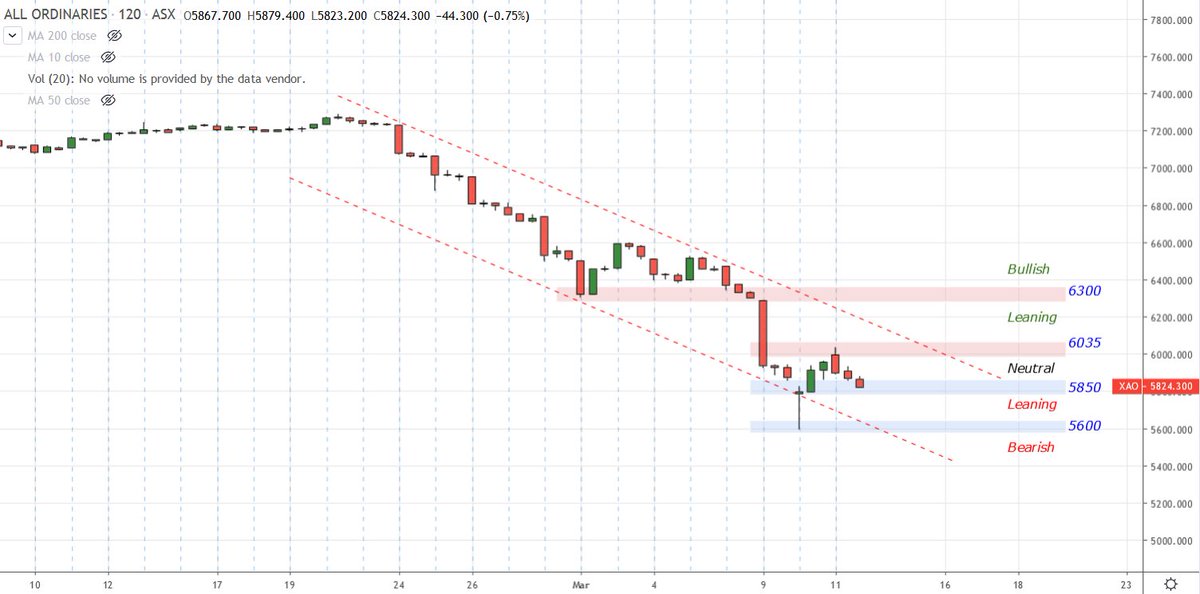
If the reactions make new lows or the rallies make new highs I adjust the S-R zones. If price breaks out of the channel and then makes a new low I redraw the channel. If price makes a new high followed by higher low I draw an up channel etc etc
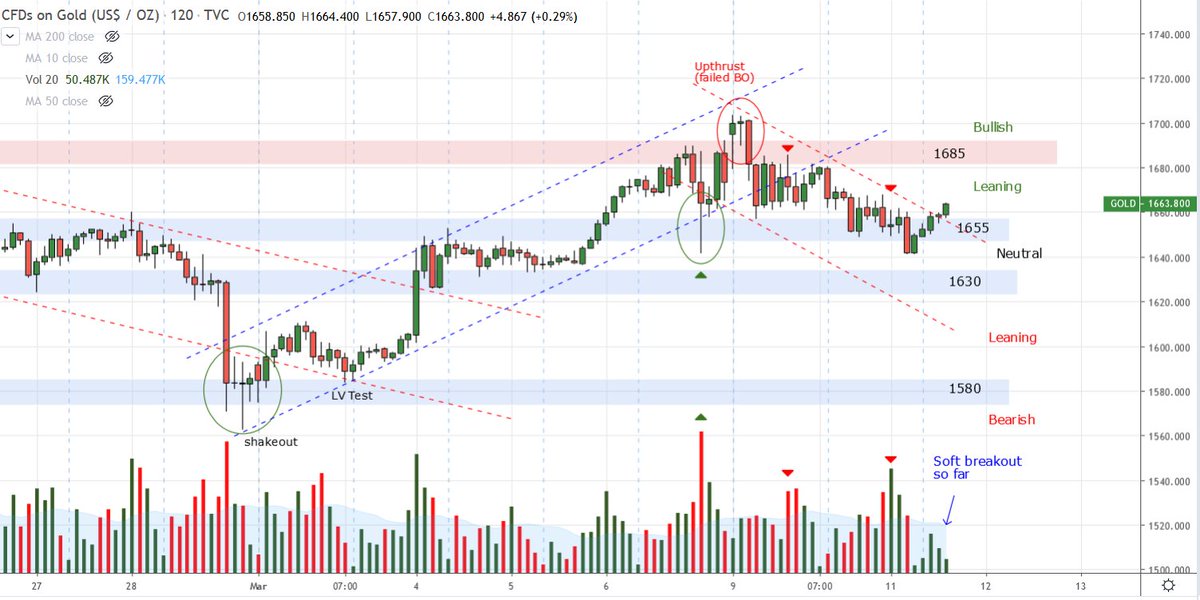
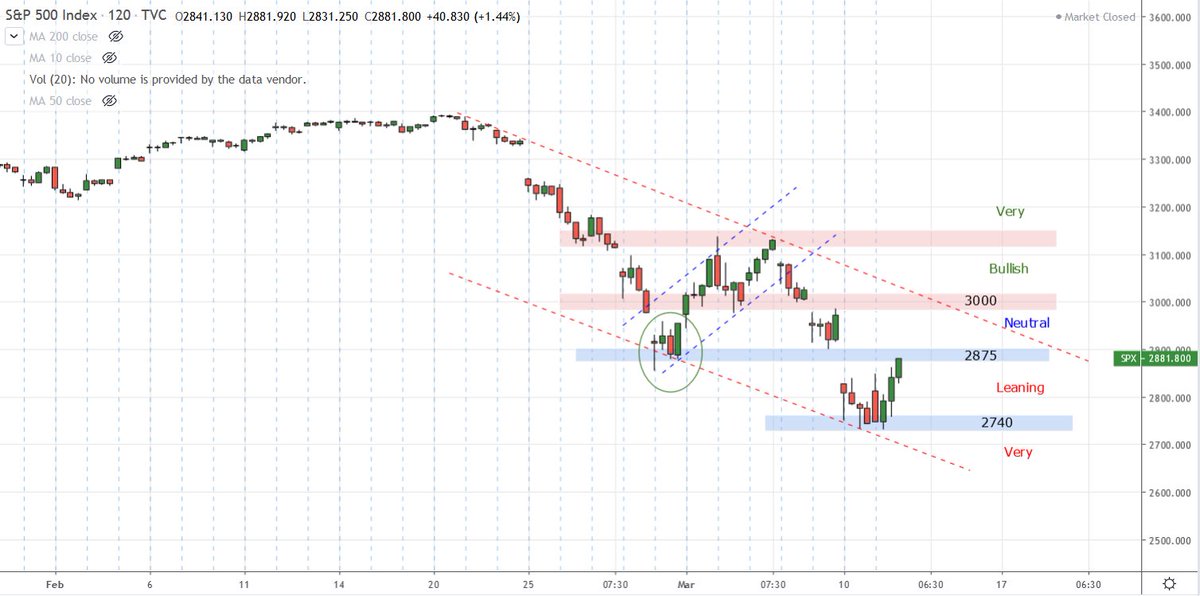
I do something similar with $GOLD and $SPX S&P500 because generally leading sentiment indicators for (1) #asx gold stocks and (2) $XAO
Missing some Tweet in this thread? You can try to force a refresh.

Enjoying this thread?

Keep Current with Stan

Profile picture

Stay in touch and get notified when new unrolls are available from this author!

Read all threads

This Thread may be Removed Anytime!

Twitter may remove this content at anytime, convert it as a PDF, save and print for later use!

Try unrolling a thread yourself!

how to unroll video

1) Follow Thread Reader App on Twitter so you can easily mention us!

2) Go to a Twitter thread (series of Tweets by the same owner) and mention us with a keyword "unroll" @threadreaderapp unroll

You can practice here first or read more on our help page!

Follow Us on Twitter!

Did Thread Reader help you today?

Support us! We are indie developers!


This site is made by just three indie developers on a laptop doing marketing, support and development! Read more about the story.

Become a Premium Member ($3.00/month or $30.00/year) and get exclusive features!

Become Premium

Too expensive? Make a small donation by buying us coffee ($5) or help with server cost ($10)

Donate via Paypal Become our Patreon

Thank you for your support!