OK, let me write a thread, with some numerical experiments, about the influence of the social graph structure on the attack rate of epidemics (attack rate = number of people infected during the epidemic). ⤵️ •1/42
First, let me recall the basic situation. I already tweeted a thread about what the very basic SIR epidemiological model predicts about the attack rate of an epidemic: see threadreaderapp.com/thread/1236324… •2/42
— there's a expanded version on my blog (in French, but Google Translate generally does a decent job): madore.org/~david/weblog/… — but in short, SIR predicts a HUGE attack rate: like, 89% for a reproduction number of 2.5. •3/42
Now real epidemics don't have such huge attack rates. Of course, they aren't well known, but (despite lack of prior immunity to the strains), the 1918 and 1957 influenzas seem to have infected around 30% of the population in many places, not around 90%. •4/42
So what's going on? Well, my explanation is that SIR, being a model based on differential equations, all it knows is what percentage of the population is susceptible, infectious, and recovered, not where these people are and how they interact socially. •5/42
In other words, such models assume “perfect mixing”: any individual is equally likely to infect any other individual. This, of course, is NOT AT ALL the case in reality. In reality, a good proportion of contagions follows a social graph (friends, family, colleagues…). •6/42
Even more sophisticated models which stratify the population by age categories (say) still assume perfect mixing in each category. I suspect this is why the Imperial College study gets such a high attack rate, I already mentioned this (thread): •7/42
So, how can we take into account the fact that contaminations follow social links, how can we simulate this, and what should we expect? I expect, and I wanted to test, two different but related effects. •8/42
One is that, if it has to (more or less) follow connections of the social graph, the epidemic will starve itself more quickly, even for a given reproduction number. This is what I tried to express, e.g., here: •9/42
This phenomenon would be related to percolation problems in graphs: see en.wikipedia.org/wiki/Percolati… — basically, how many edges or vertices you need to remove from a graph before it stops having a giant connected component. •10/42
The idea being that once enough people are immune, the epidemic can no longer get from one person to another. This happens gradually in perfect mixing (), but I expect it to happen earlier on a far less connected graph. •11/42
The second phenomenon is slightly different: not only should it be necessary to remove fewer vertices to stop the epidemic (above), but the epidemic should remove (i.e., infect) its most “precious” nodes earliest, because they are the most connected ones. •12/42
This is what I tried to express here: … •13/42
Or here (see the next few tweets as well): — basically, politicians and celebrities are infected before the rest, because they see a lot of people, and when the become immune the epidemic slows down immensely. •14/42
OK, so much for my intuition. Now let's see if I can model all of this. I'm not going to try to quantify the effects (there are simply too many parameters to fiddle with!) but merely illustrate that they can exist and seem to work in the direction I mentioned. •15/42
So I wrote a little Perl program that simulates a stochastic SEIR epidemic model: nodes (people) move between the S (“Susceptible” = uninfected), E (“Exposed” = incubating), I (“Infectious”) and R (“Recovered” = immune or dead) states. •16/42
For simplicity, my program postulates that once a node (person) is infected, they move through the E/I/R stages in a fixed time. But we can play with how people infect each others. •17/42
At one extreme, we can have purely random infections, i.e., perfect mixing: each infectious node, at each time step, with a certain probability, randomly infects some other random node. No social structure. This is very close to S(E)IR differential equations. •18/42
At the other extreme, we can restrict infections to happen only following a social graph. And even then, the graph can be constructed in various ways: we can take a random graph with a certain mean connectivity (pretty much homogeneous, no really highly connected nodes). •19/42
Or we can take a graph constructed with a power law on vertex connectivity: there's a standard model for this, the Barabási-Albert model, see arxiv.org/abs/cond-mat/9… (Science 286 (1999) 509–512, “Emergence of Scaling in Random Networks”). •20/42
To construct a fairly homogeneous random graph (as in tweet 19), we create it one vertex at a time, each time connecting the vertex to a number (perhaps randomly chosen) of randomly chosen other preexisting vertices. In contrast, … •21/42
… to construct a graph in the Barabási-Albert model, we create it one vertex at a time but we pick the vertices to connect proportionally to the number of edges they already have, or equivalently, connect to a vertex of a random preexisting EDGE. •22/42
The latter gives a graph with a high “celebrity” effect whereby already highly connected nodes tend to get even more highly connected as the graph grows. This replicates the effect observed on many kinds of social graphs, as explained in the Barabási-Albert paper. •23/42
I'm not saying this model is ideal for simulating the spread of epidemics, but I want to merely test how various effects have an impact and in which direction, so let's go with that. •24/42
So anyway, the program I wrote and used is here: github.com/Gro-Tsen/epide… (see the comments at the start for how to use it; basically, tweak the parameters and then plot the output). •25/42
But there's one more problem which must be solved before we compare attack rates in various scenarios and graphs: what is to be kept constant? My program takes various parameters as input, but mostly a “probability of contagion” per time step and per link. •26/42
This is not something we can observe directly. The most obvious thing we CAN observe in an epidemic is the growth rate: i.e., the logarithmic derivative (derivative with time of the log) of the number of infected people. •27/42
Another thing we can try to compute is the reproduction number. But even this is a bit delicate to observe. (In the SIR number with parameters β (infection rate) and γ (recovery rate), the exponential growth parameter is β−γ and the reproduction number β/γ. … •28/42
… But this isn't easy to transpose in other scenarios.) What I did was this: tag each infected individual with a “generation”: generation 0 are the infection seeds, and anyone first infected by a generation g individual is tagged generation g+1. •29/42
So then the reproduction number should be the logarithmic slope of the number of people infected in generation g. Problem is, this isn't at all constant with g! So I'm using the maximal slope along a two-generation interval to estimate the reproduction number. •30/42
Similarly for the logarithmic slope of the number of infected people with time, I compute the maximal slope along a sufficiently large interval. This is not very satisfactory, but I don't really know what else to do. •31/42
So what I tried to achieve is, in three different extreme scenarios (random mixing as in tweet 18, unbiased graph as in tweet 19, and highly social graph as in tweet 20), find input parameters to my program which give comparable growth rates and reproduction number, … •32/42
… and then compare the final attack rates. I tried to be conservative in the sense of “these parameters give a slightly higher growth rate and reproduction number than in unbiased mixing for these other parameters, but still give a lower attack rate”. •33/42
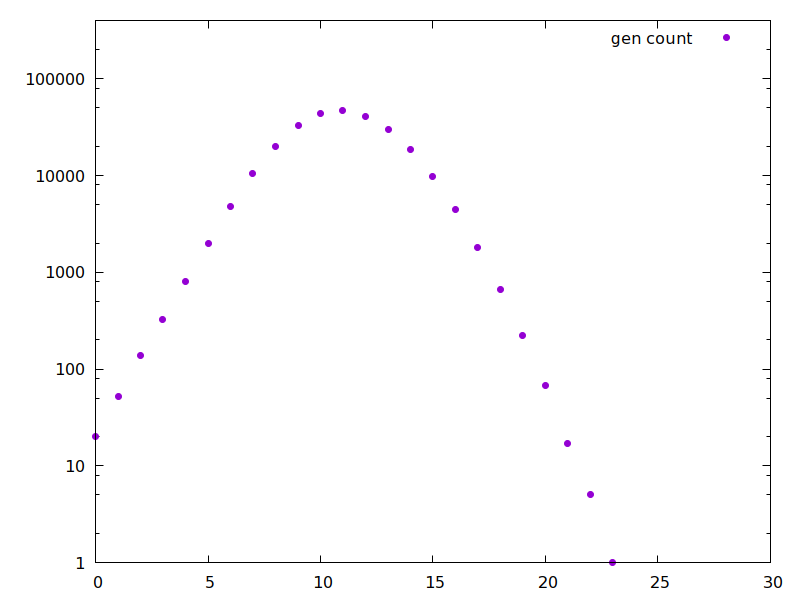
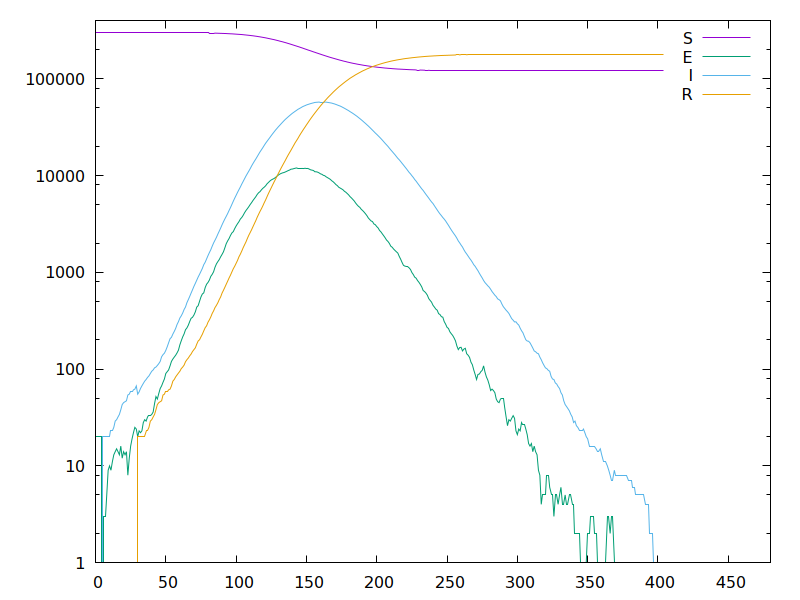
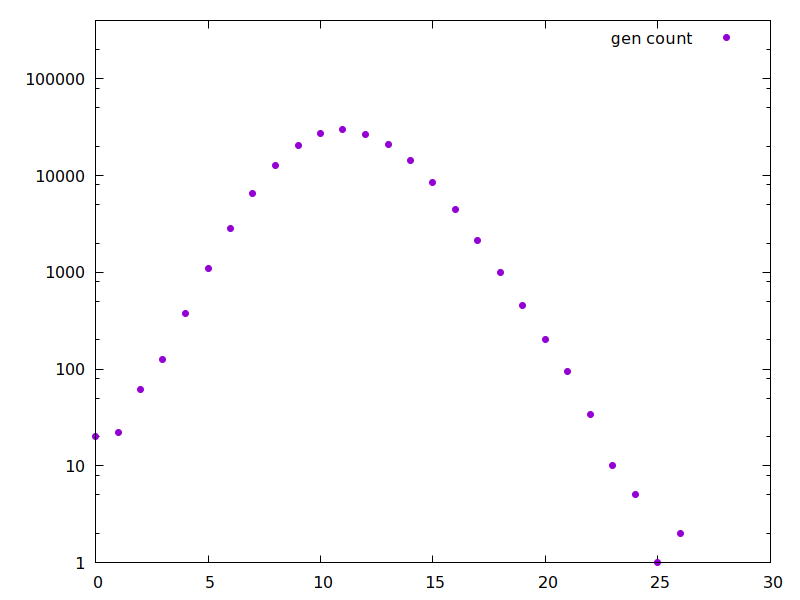
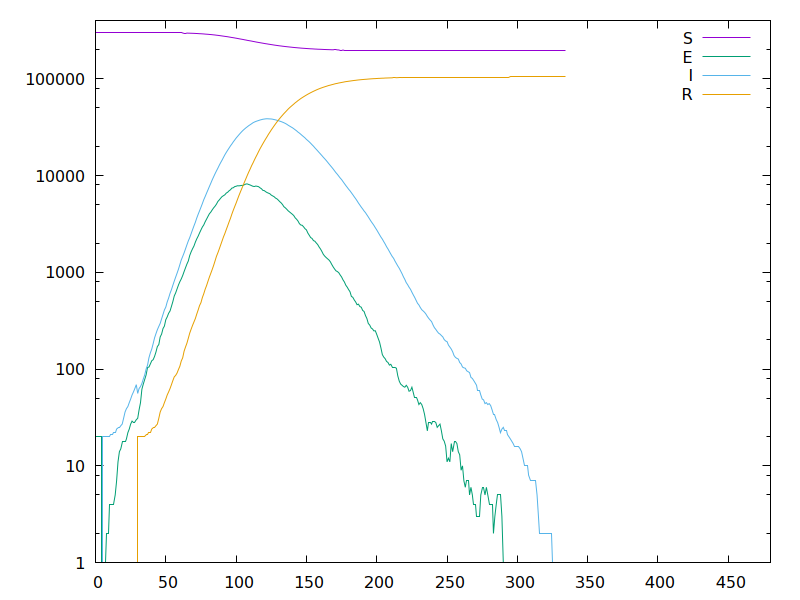
Anyway, some simulations! Each time I give three images: the first is the evolution of the epidemic as a function of time; the second is the number of individuals infected for each generation; and the third gives the parameters used and various stats on the epidemic. •34/42
First, a simulation with purely random mixing (as in tweet 18): here the measured reproduction number is 2.44 and we get 89% attack rate, almost exactly what SIR predicts for this attack rate: this is the basic situation, absent any social network effects. •35/42 
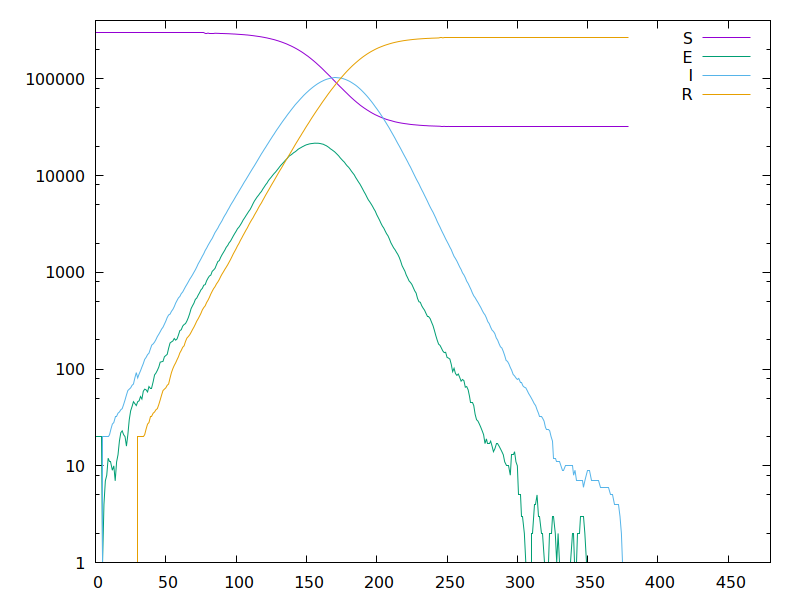
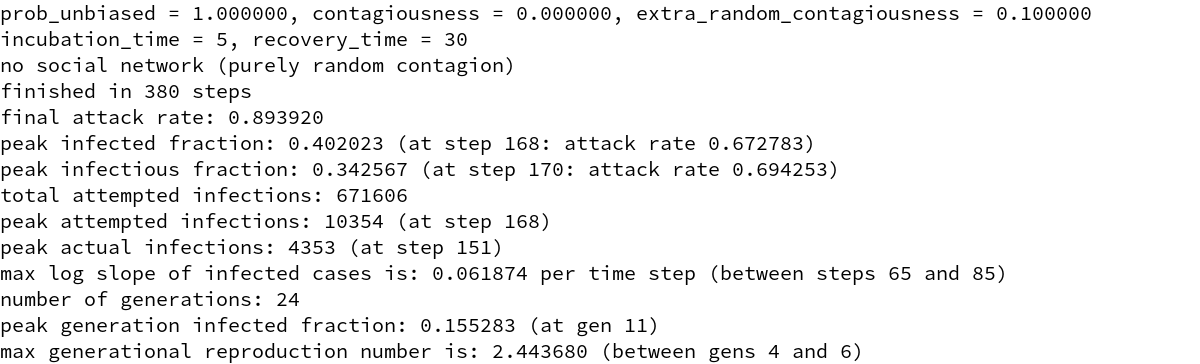
Second, a simulation on a random unbiased graph (as in tweets 19&21) with average degree 10: here the parameters have been set to match the same reproduction number, and we have a higher time growth rate, but the attack rate is lower, only 60%. •36/42
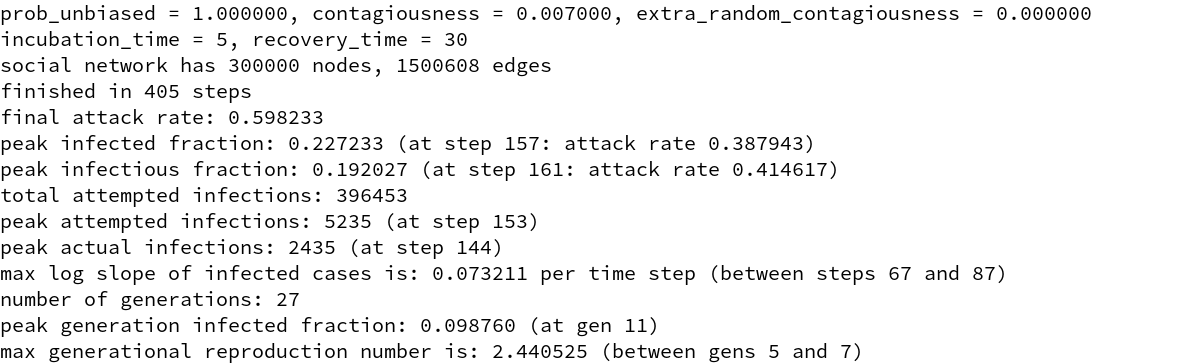
So this simulation seems to bear out the intuition I expressed in tweets 9–11, that forcing the epidemic to follow a graph with relatively low connectivity, even with a fixed reproduction number, considerably reduces the attack rate. •37/42
Also pay attention to the attack rate at the point of peak infection, because this is an estimation of the point at which herd immunity is achieved: if we suddenly quench the epidemic at this point, it should be more or less stable. It was reduced from 67% to 39%. •38/42
How much can we count on this effect in real life? I have no idea! But it's true that many if not most infections seem to follow a social link, rather than random encounters; and as I mentioned, real epidemics seem to stop way before ~90% attack rate. •39/42
Finally, a simulation on a social graph (as in tweets 20&22). This is a somewhat extreme social graph, where the number of nodes with at least k neighbors drops as ~C·k^−2. Real-life social networks probably aren't so extreme! But still, let's see what happens: … •40/42
… using parameters which give a similar reproduction number, even with a higher max growth rate in time, we still get a lower final attack rate: only 35% (and possibly herd immunity around 23%). This seems to corroborate my intuition from tweets 12–14. •41/42


Again, this gives NO quantitative analysis, because there are just too many free parameters. I'm not saying Covid-19 will have an attack rate of 35% or whatever. I'm merely saying that social network effects COULD make it MUCH below 80% even absent any intervention. •42/42