My Authors
Read all threads
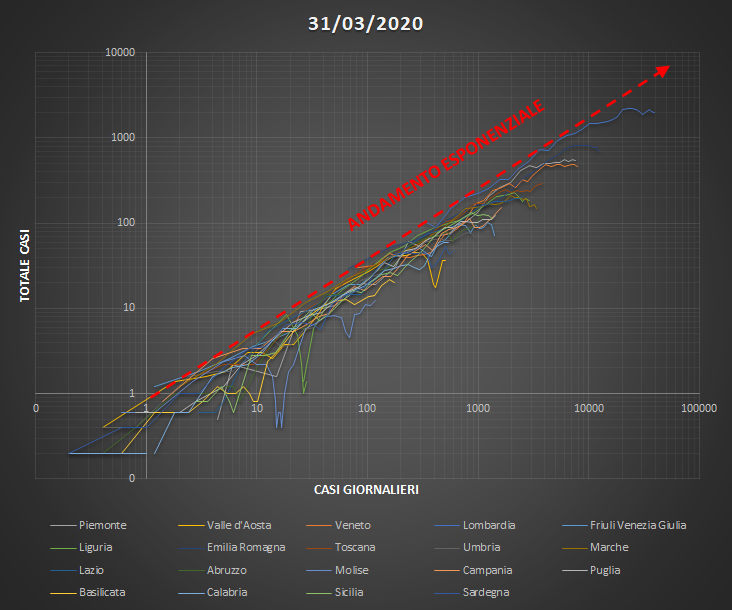
sono incappato in questo video molto interessante su un modo efficace di visualizzare l'evolversi dell'epidemia in un grafico bi-logaritmico


#COVID19italia
#coronavirus
#COVID19
In sostanza si plottano i casi totali in funzione di quelli giornalieri, ciascuno in scala logaritmica. Durante l'evoluzione esponenziale il grafico si muove su una retta. Quando l'epidemia rallenta i dati si allontanano a destra della retta

#COVID19italia
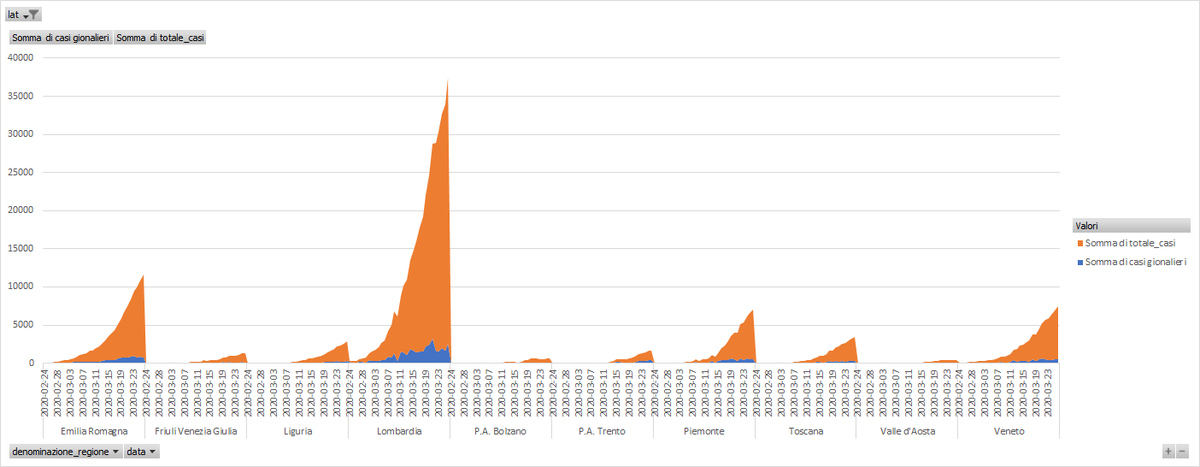
Ho preso i dati ufficiali per regione a questo link github.com/pcm-dpc/COVID-… e li ho processati come descritto sopra, ecco il risultato:
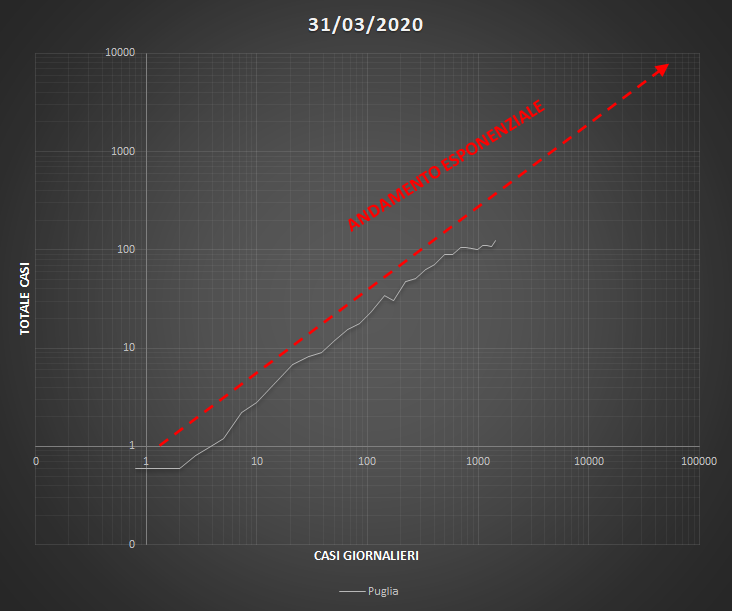
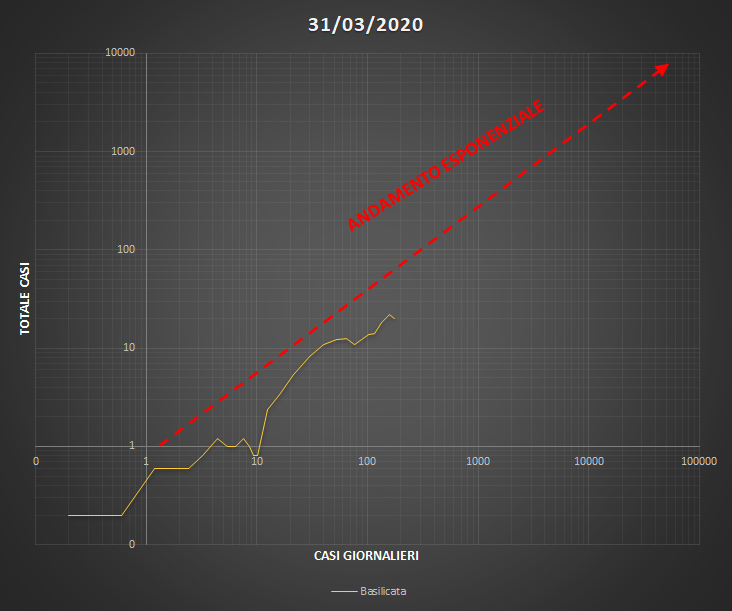
(Segue un grafico per ogni regione)
#COVID19italia
#coronavirus
#COVID19
NORD/ CENTRO / SUD
#COVID19italia
#coronavirus
#COVID19
FRIULI VENEZIA GIULIA

#COVID19italia
#coronavirus
#COVID19
Missing some Tweet in this thread? You can try to force a refresh.

Enjoying this thread?

Keep Current with Alessandro Liuto Giusto 🇮🇹

Profile picture

Stay in touch and get notified when new unrolls are available from this author!

Read all threads

This Thread may be Removed Anytime!

Twitter may remove this content at anytime, convert it as a PDF, save and print for later use!

Try unrolling a thread yourself!

how to unroll video

1) Follow Thread Reader App on Twitter so you can easily mention us!

2) Go to a Twitter thread (series of Tweets by the same owner) and mention us with a keyword "unroll" @threadreaderapp unroll

You can practice here first or read more on our help page!

Follow Us on Twitter!

Did Thread Reader help you today?

Support us! We are indie developers!


This site is made by just three indie developers on a laptop doing marketing, support and development! Read more about the story.

Become a Premium Member ($3.00/month or $30.00/year) and get exclusive features!

Become Premium

Too expensive? Make a small donation by buying us coffee ($5) or help with server cost ($10)

Donate via Paypal Become our Patreon

Thank you for your support!