
We’re about to start live-tweeting our Summer Student Showcase: Visualizing Science virtual event! Check here for tweets on visual communication research and how it applies to #scicomm, #infographics, #branding, and #socialmedia! ⬇️ @ComSciConCAN @ComSciConQC @AlexGelle
Give us a follow, tag us @designsthatcell and use #DTCSummerShowcase to let us know what you think about the event! We'd love to connect with you 🤗
Our founder, @NersesianSarah, is opening today’s event by introducing our summer internship program and today’s awesome speaker lineup! The intern program was developed to support undergraduate students who lost #research or #scicomm opportunities due to COVID-19 restrictions.
Our student internships included positions as research interns, a social media intern, and a marketing intern from universities across Canada including @WesternU, @uofg, @queensu, @uOttawa and @McMasterU.
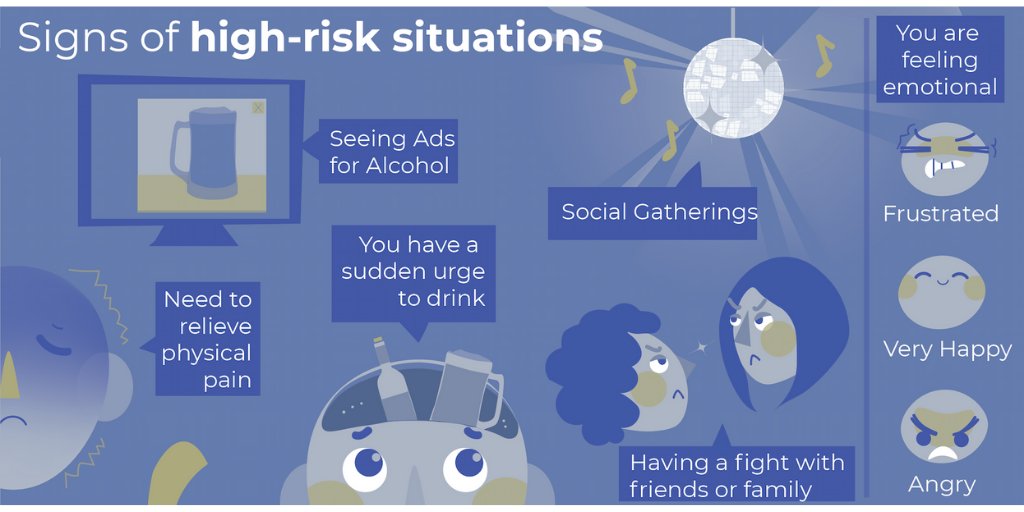
Ready for some tips for creating infographics?! ✅ Research intern & @WesternU student Shan Grewal researched how visual communication can be applied to alcohol misuse treatment & collaborated with senior illustrator Naomi Robson to create an informative infographic. #scicomm
During his research, Shan found that 80% of Ontarians report consuming alcohol and 16% reported hazardous or harmful drinking habits. There are over 170 addiction treatment centers in Ontario with over 47,000 users per year. 🍺
Addiction treatment involves a lot of complex information and there is often a large gap between educational background level and the understanding of complex health information. 🤔💭
Infographics are an efficient and useful visual communication tool that can be applied to alcohol misuse treatment to improve understanding of medical information. ‼️ Sneak peek of a part of Shan and Naomi’s infographic below ⤵️
#SciComm #Infographic #AlcoholTreatment
#SciComm #Infographic #AlcoholTreatment
Shan’s top 3 tips for creating a successful infographic:
1️⃣ Select 3 main ideas to include. Focus on actionable info that service users can incorporate and avoid detailed explanations of scientific theories behind the information.
1️⃣ Select 3 main ideas to include. Focus on actionable info that service users can incorporate and avoid detailed explanations of scientific theories behind the information.
2️⃣ Reduce cognitive load. 👀🧠 Decrease sensory information that occupies mental resources by keeping designs simple, not embellishing pictures, and removing unnecessary words.
3️⃣ Use text effectively! Don’t omit text completely, use it to supplement and avoid misunderstandings. Keep captions close to the corresponding image, avoid jargon, and text should be written at 6th grade reading level or below (see SMOG index). 📖
Next steps: Shan will be developing a pilot study to assess the effect of infographics on the comprehension of alcohol misuse treatment. He’s also interested in how other professionals can apply visual #scicomm strategies to other forms of treatment! @WesternU @CCSACanada
Our next speaker is @McMasterU student Kobika Selvarajah who was our social media summer intern! She will be discussing the projects she worked on this summer, including a Beginner’s Guide to SciComm through Social Media! #SciComm #SocialMedia @scicommsci @scicomm_jc
“Effective science communication aims to disseminate science-related information in an accurate and accessible manner.” Emphasis on the word "accessible"! 🗣👂
Here are Kobika’s 5 steps to approaching social media as a scientist:
1️⃣ Understand the differences between each social platform and how they compliment your specific objectives. Each platform varies in audience and thus what type of content is appropriate to be shared.
1️⃣ Understand the differences between each social platform and how they compliment your specific objectives. Each platform varies in audience and thus what type of content is appropriate to be shared.
2️⃣ Next, plan your posts using a campaign strategy. Include the campaign objectives, the strategy summary, success metrics, specific strategy details, and campaign examples.
3️⃣ Got your strategy? Now it’s time to create content! Tip: Make sure your visuals are sized for each specific platform to optimize how they’re viewed by your audience.
Some helpful tools for content creation: @powerpoint, iMovie, @KapwingApp, @pixlr, and @freemusicarchiv
Some helpful tools for content creation: @powerpoint, iMovie, @KapwingApp, @pixlr, and @freemusicarchiv
4️⃣ Save time and stay organized by scheduling your content ahead of time. Pay attention to engagement in order to schedule content on specific days/times when you’re most likely to reach your audience. Tip: Try @hootsuite!
5️⃣ Kobika’s also suggests to track KPIs (Key Performance Indicators) for all your social channels. Tip: Compile monthly data on engagement metrics in a spreadsheet for easy reference. This allows you to visualize your growth and make adjustments as needed! 📈

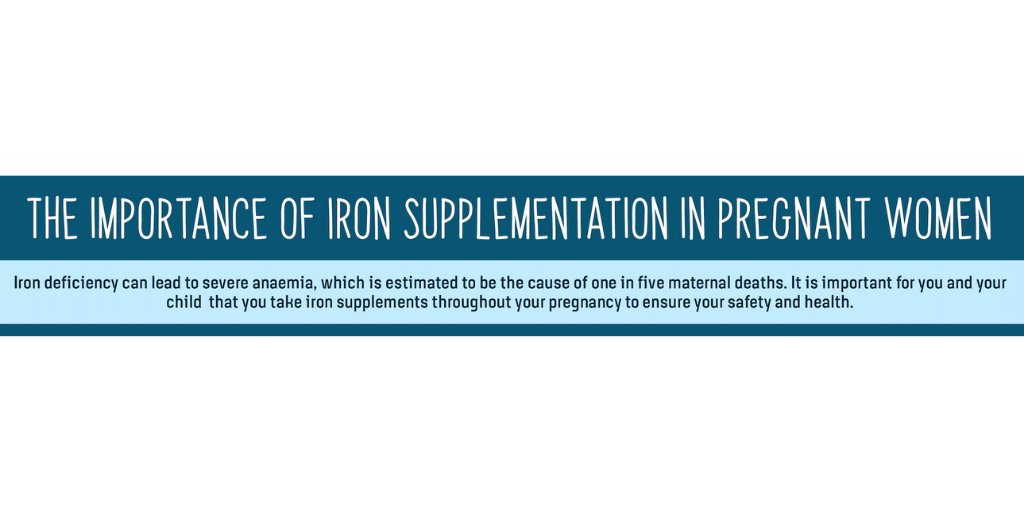
Next up is @uogf student and one of our research interns, Abdullah Chanzu! This summer, Abdullah examined how the use of infographics affects adherence to medication, specifically iron supplementation in pregnant women. #health #research #scicomm
Did you know that 20% of maternal deaths are caused by severe anemia and that up to 40% of women are anemic during pregnancy? 🤰🏽
Iron supplements can help to treat anemia, but medication adherence is a large barrier to improved health outcomes! So how can infographics help? 🤔
Iron supplements can help to treat anemia, but medication adherence is a large barrier to improved health outcomes! So how can infographics help? 🤔
Infographics are flexible, allow info to be visualized, come in many formats, and can be adapted to different culture contexts and languages. 🗣🌏 Brief text and images show greater retention by the reader than long-form text!
Infographics are shown to improve medication adherence and quality of life by helping patients to understand their susceptibility and outcome severity, as well as the perceived benefits and barriers to adherence. 💛 #healthcare
This summer, Abdullah performed a #litreview and collaborated with one of our junior illustrators, Molly Wells, to create an evidence-based infographic as an educational tool for adherence to iron supplementation medication in pregnant women. 👀 Sneak peak at the title below ⬇️
Next steps: Abdullah will be implementing his infographic for use in clinical and online settings as well as pursuing a pilot study using the new infographic to assess the benefits of infographics in medication adherence. #SciComm #healthcare #Infographics

"The most difficult part of turning [science] research into a visual project is understanding how to turn jargon into something that's easily understandable by all people." #scicomm #accessibility
Our next speaker is Lydia Elbatarny, a @queensu student who will be talking about her experience as the Designs that Cell marketing intern. She will be sharing her top tips for creating an attention-grabbing visual brand strategy 👀 #branding #MarketingStrategy #marketingtips
When creating a visual brand you want to:
👀 Catch attention and keep it
🤝 Project an image of unity and quality
😇 Create a sense of trust with your audience
#brandingtips
👀 Catch attention and keep it
🤝 Project an image of unity and quality
😇 Create a sense of trust with your audience
#brandingtips
The 4 major visible elements Lydia applied to our visual brand were:
1️⃣ Font personality: Our display font is approachable and playful, our secondary semi serif font is bold and authoritative, and our third condensed sans serif font is focused and sound
1️⃣ Font personality: Our display font is approachable and playful, our secondary semi serif font is bold and authoritative, and our third condensed sans serif font is focused and sound
2️⃣ Illustration style: our graphic elements are rounded, use soft precision, and have a caricature feel to portray an engaging, youthful, artistic style
3️⃣ Minimal but visible: We use negative space strategically to enhance text and visuals
3️⃣ Minimal but visible: We use negative space strategically to enhance text and visuals
4️⃣ Colour psychology: Our brand colours match our brand persona. 🧡 Orange for excitement, enthusiasm, & warmth, 💎 Teal for wisdom & creativity, and 💙 Blue for stability & order.
Looking to expand your visual brand? Try creating a newsletter! Lydia developed the DTC newsletter this summer using an infographic style since we are a science-based company. #newsletter #Marketing
“Read the numbers but also read your audience!”
Remember, design is just the first part for developing your visual brand! Make sure to follow how people are engaging and responding to your brand. 👩🏼💻 #brandvoice #marketingtips
Remember, design is just the first part for developing your visual brand! Make sure to follow how people are engaging and responding to your brand. 👩🏼💻 #brandvoice #marketingtips
Balance professionalism and fun in your personal brand by "picking 3 or 4 elements that you want to put forward in your visual brand and consider how you can embody these in your design staples". #brandingtips
We're at our last speaker already! Research intern and @uOttawa student Geneviève O’Keefe worked with junior illustrator Anupreet Kharbanda to create, distribute and analyze infographics for use in undergraduate organic chemistry instruction! 🧪 @organic_portal
“A sure way to kill a conversation is to confess that you are a chemist” 😂🤭 Do you agree!?
#ChemTwitter #chemistry
#ChemTwitter #chemistry
Geneviève wants to change this opinion about chemistry and improve both student and public perceptions of chemistry education!
Instructors are always looking for novel teaching methods and ways to improve student attitudes towards organic chemistry. 🤗 When creating an infographic as an educational tool, make sure it’s appropriate for your audience. Get feedback!
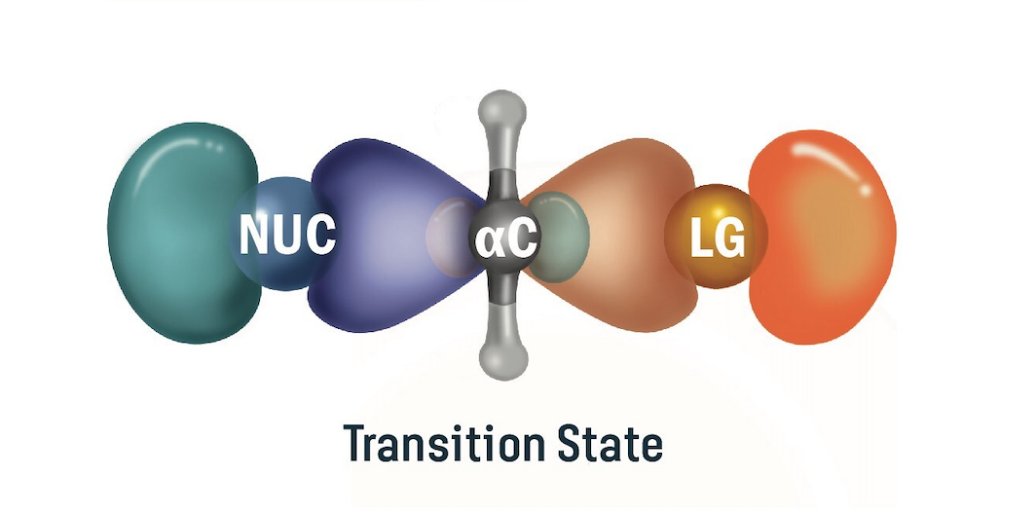
Geneviève and Anupreet developed and created infographics to explain organic chemistry concepts of chirality and an SN2 reaction. Here’s a sneak peek of part of the chirality infographic ⬇️
#Infographic #ChemTwitter
#Infographic #ChemTwitter
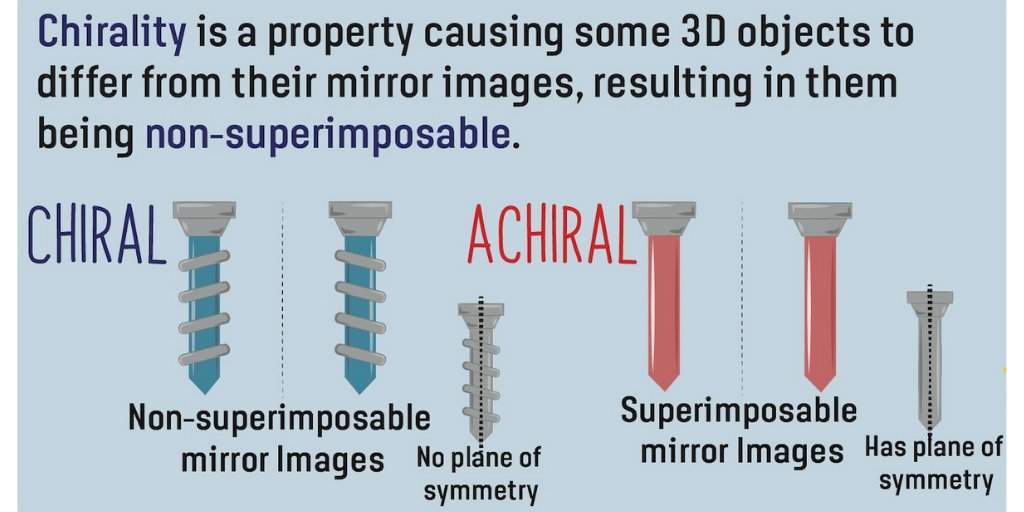
3D illustrations are particularly useful for chemistry education in order to understand the shape of molecular structures. Here's how our junior illustrator Anupreet visualized stereochemistry using a 3D illustration 👇🏼
#SciArt #Infographic #chemistry
#SciArt #Infographic #chemistry
Geneviève’s future plans are to perform a large scale mixed methods study on undergraduate students (in both French and English) to study the effect of her infographic on retention, comprehension, and overall interest of undergraduate organic chemistry.
“Quality French resources are really limited in academia. As a French-speaking student, it was important to me to translate this infographic for French-speaking students”.
Did you enjoy these tips on visual communication, infographics, visual branding, & social media for scientists?
Make sure to give us a follow for more #SciComm, #Science, and #Illustration info/resources! 🙋🏻♀️
Thank you to all who attended & followed along with today's event! 🤗
Make sure to give us a follow for more #SciComm, #Science, and #Illustration info/resources! 🙋🏻♀️
Thank you to all who attended & followed along with today's event! 🤗
• • •
Missing some Tweet in this thread? You can try to
force a refresh


