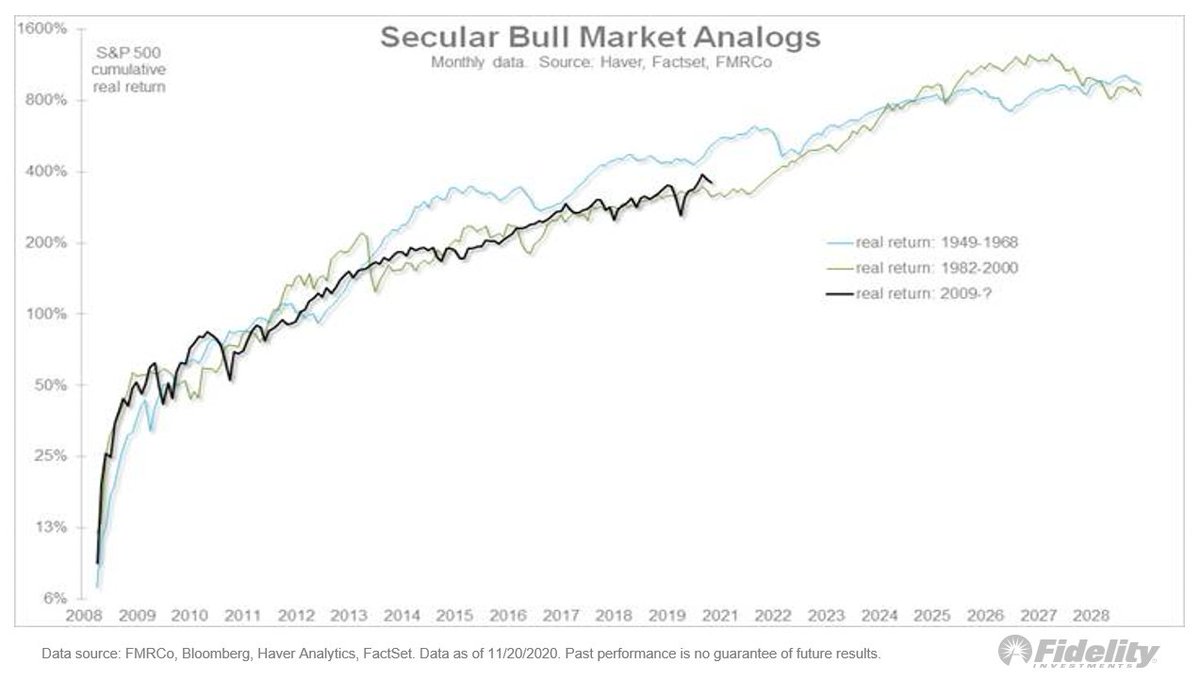
Let’s compare two important historical market regimes to the post-GFC era. Here, I isolate the era of financial repression from 1942-51, and the secular rise in inflation from the early 1960s to the early 1980s. (THREAD /1)
I am showing these charts as a scatter plot of nominal returns (x) and real returns (y). It’s an unusual format (without the time scale) but it shows the trends clearly. /2
The financial repression era started in 1942 w/ the buildup to WWII & ended when the Fed gained independence in 1951. The federal debt tripled & the Fed monetized it all while pushing real rates firmly negative via rate caps. That same conversation appears to be happening now. /3
The secular inflation era started when inflation and bond yields ended their “low-for-long” period in the early/mid 1960s and started rising, slowly at first, then all at once. /4
As inflation and rates rose, and the secular bull market matured and eventually peaked (with a speculative frenzy in 1968), the stock/bond correlation went from steeply negative in 1960, to flat in 1964, to positive during the 70s and 80s. /5
Now, let’s take a closer look at these analogs. We already know that both the 1940s and the late 60s-70s produced bouts of inflation. It’s pretty clear that value stocks and especially small cap value were outstanding inflation hedges. /6
Left behind were large cap growth stocks. That couldn’t be more different from the post-GFC era, although value and small caps have been catching up quickly since last fall. /7
If the current financial repression era has further to go and ends up producing structural inflation, then one look at the chart above tells you that the rotation from growth to value, and from large to small, could end up being secular rather than cyclical. /8
How did bonds and commodities behave during these regimes, compared to the current cycle? This chart shows long-term bonds and high-yield, commodities, and gold and silver. /9
The middle of the chart shows what you would expect, knowing what interest rates, inflation and gold did during the 70s. That huge spike in silver? The Hunt Brothers episode in 1980. The large decline in the blue lines shows the effects of interest rates soaring. /10
The cluster on the left seems counterintuitive, knowing that inflation spiked several times during the 1940s. But with the Fed monetizing the war debt and capping short rates at 3.8% and long yields at 2.5%, there was no return and no volatility to be had in the bond market. /11
Gold was fixed at around $35 during the 40s, so there was no return or volatility to be had there. But even the CRB did poorly during that time, which is a bit surprising. Stocks were the only game in town, nominal or real. /12
Moving to the upper right side of the above chart, we see the post-GFC monetary inflation era. Commodities have performed poorly, and basically nothing has been able to keep up with equities (much like the 1940s, but unlike the 1970s). /13
See that pink line going straight up past the SPX? I indexed #bitcoin to the price of gold as of March 2020, which is when bitcoin’s latest rise began. This shows what might have happened to the price of gold, had it been the only game in town as a monetary inflation hedge. /14
In short, during past eras of financial repression & rising inflation, value beat growth, small beat large, stocks beat both bonds & commodities, but commodities were better than bonds. Something to remember in case the current era of monetary inflation lasts a while longer. /END

• • •

Missing some Tweet in this thread? You can try to force a refresh
 

Keep Current with Jurrien Timmer

Jurrien Timmer Profile picture

Stay in touch and get notified when new unrolls are available from this author!

Read all threads

This Thread may be Removed Anytime!

PDF

Twitter may remove this content at anytime! Save it as PDF for later use!

Try unrolling a thread yourself!

how to unroll video
  1. Follow @ThreadReaderApp to mention us!

  2. From a Twitter thread mention us with a keyword "unroll"
@threadreaderapp unroll

Practice here first or read more on our help page!

More from @TimmerFidelity

8 Mar
Bitcoin is in the spotlight these days but let’s not rule out #gold. Let’s assume that in coming years the current fiscal/monetary regime were to produce the same kind of 10% growth rate (CAGR) in the money supply that the 1930s/1940s & the 1970s produced (THREAD/1)
Looking back, both periods produced a 10% CAGR for M2 that lasted at least 10 years and that took M2 from below its long-term exponential trendline to above it. Both these previous periods produced a strong advance in the above-ground market value of #gold relative to M2. /2
What if we see this pattern again? What do I think that would that mean for the price of gold and how might this dynamic change now that #bitcoin has entered the scene and seems to be cannibalizing gold? /3
Read 7 tweets
15 Dec 20
Earnings & the #Fed. I assumed the 1930s weren’t a good analog for 2020 b/c the fiscal/monetary policy response this year was greater & faster than ever, except perhaps the ‘40s. Policy response matters & in 2020 it blew away steps taken in ’08. How it started… (THREAD/1) Image
#Earnings & the #Fed. How it’s going… /2 Image
During volatile March, the 1987 crash was a better analog in the speed of the decline in stock prices & in the spike in the #VIX—VXO then. Also: the 1987 episode produced a full retest & pretty slow recovery. The analog worked in helping identify the market’s exhaustion point. /3
Read 7 tweets
27 Nov 20
Let’s revisit secular trends, looking at the secular bull markets of 1949-1968 & 1982-2000. We’re at the point where the long-term momentum of #stocks vs #commodities has peaked in the past. This chart shows a lot of cyclicality when it comes to financial vs real assets. 1/THREAD Image
During the 1949-1968 cycle, growth peaked against value right about now (in terms of the 10-year CAGR), while during the 1982-2000 cycle the 10-year CAGR flattened for a few years before spiking into what became the dot-com bubble in 1999-2000. 2/ Image
So is this the 1960s or the 1990s? Given that we have already experienced a parabolic out-performance phase for large-cap growth, I like the 1949-1968 analog here, in which case we are somewhere in the early 1960’s. 3/
Read 7 tweets
25 Nov 20
A secular fork in the road: Here, the secular bear mkts & secular bull mkts interspersed. It’s my thesis that we’re in a secular bull mkt which, at 11 years old (since the #SP500 index started making new highs in spring 2013), I believe is only in its 5th or 6th inning. 1/THREAD
The double-digit CAGR, the short & swift bear markets followed by robust recoveries to new highs, and the steady expansion in valuation multiples all spell “secular bull” in my view. 2/
The post-global financial crisis (GFC) #bullmarket continues to closely track the secular bull markets of 1949-1968 and 1982-2000. It’s a sample size of only two but the analog suggests we may have a ways to go still. 3/
Read 13 tweets
20 Aug 20
(1/THREAD) Sentiment: One might think, with the #market erasing all its losses, that sentiment would have gotten somewhat lopsided, but it hasn’t. Here, flows into equity funds & ETFs & money market funds. #equities #SPX
2/ The rush into #cash has barely been undone, while #investors aren’t exactly rushing into #equities. While cash sitting in money market funds has dropped slightly from nearly $5 trillion to about $4.55 trillion, it has fallen from 17% to 13% as a percent of equity market cap.
3/ Looking at the percent of equity market capitalization is probably a better way to slice the data as a proxy for sentiment and it has matched almost perfectly the spread on high-yield corporate #bonds. The rest of the sentiment picture is mixed too.
Read 8 tweets
18 Aug 20
Valuation: It’s a contested issue in the market. Are stocks as divorced from fundamentals as many say? This chart shows that’s a fair point. While the #SPX is up 50% from the low, the NTM P/E multiple has almost doubled. Image
But, in my view, the bearish P/E argument misses something important: At bottoms, price usually leads #earnings. So there are going to be periods where price goes up while earnings still go down which, mathematically, leads to a rising P/E ratio.
The same thing happened in 2009 after the GFC bottom. Look: an analog of the inflation-adjusted #SP500 index now & back then. Bottom panel: Earnings as measured from the price low—not the earnings low. Back in ’09, EPS fell another 5% after the #SPX bottomed on March 9. Image
Read 12 tweets

Did Thread Reader help you today?

Support us! We are indie developers!


This site is made by just two indie developers on a laptop doing marketing, support and development! Read more about the story.

Become a Premium Member ($3/month or $30/year) and get exclusive features!

Become Premium

Too expensive? Make a small donation by buying us coffee ($5) or help with server cost ($10)

Donate via Paypal Become our Patreon

Thank you for your support!

Follow Us on Twitter!