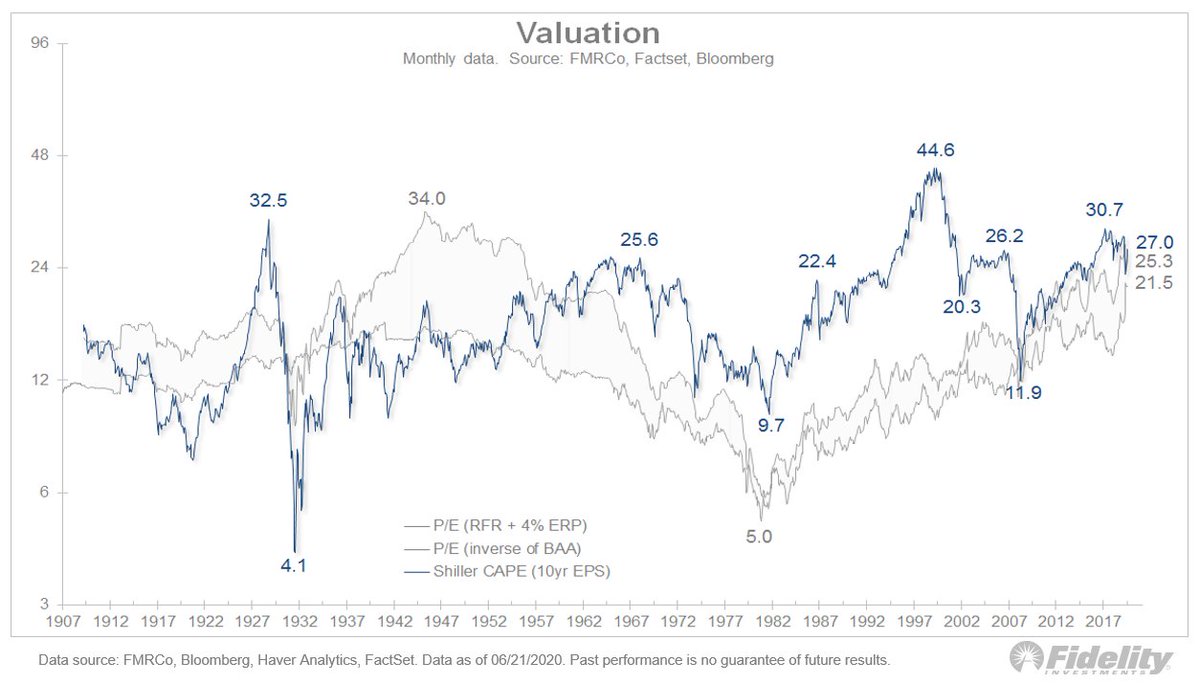
Valuation: It’s a contested issue in the market. Are stocks as divorced from fundamentals as many say? This chart shows that’s a fair point. While the #SPX is up 50% from the low, the NTM P/E multiple has almost doubled. 
But, in my view, the bearish P/E argument misses something important: At bottoms, price usually leads #earnings. So there are going to be periods where price goes up while earnings still go down which, mathematically, leads to a rising P/E ratio.

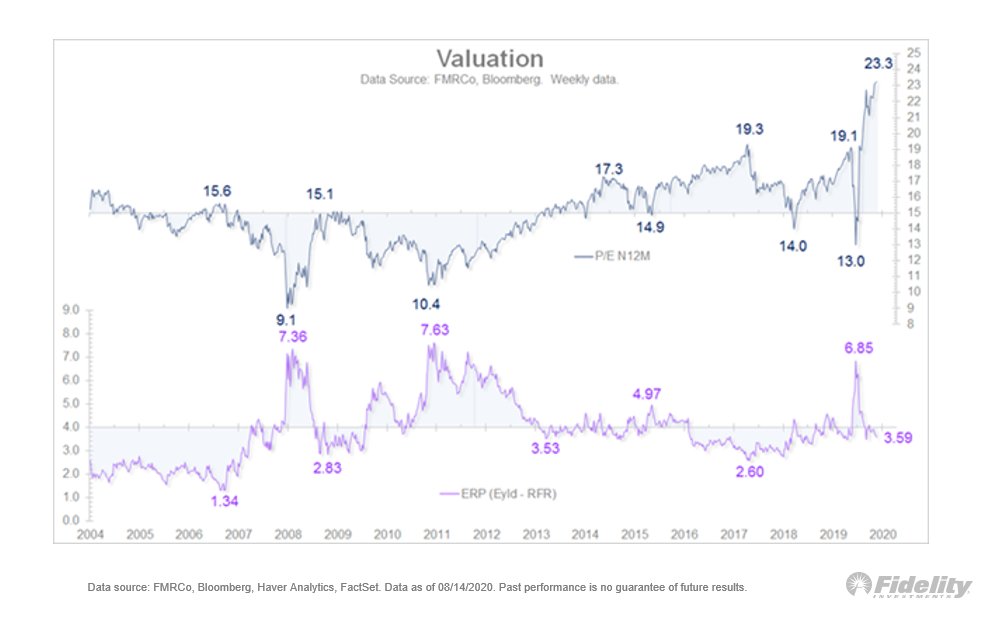
The divergence in price v. earnings leads to a big but temporary dislocation in valuation. This chart shows the trailing P/E ratio has risen from 14.2x at the low to 24.3x today. In ’09, the trailing P/E ratio rose from 16.4x at the low to 24.9x five months later. Same story!

This suggests the P/E ratio will start to fall very soon as earnings catch up to price.
Will history repeat itself? Good question. If earnings bottom now (or soon) and grow at anywhere near their pace of 2009, valuations will most likely fall back into the high teens, as is suggested by current consensus earnings estimates.
One other dimension to this analog: financial engineering. Will it be as prevalent now as it was in the aftermath of the global financial crisis? Back then, share buybacks came back in a big way and that certainly helped boost the earnings narrative.

This chart shows the equity risk premium up top and share buybacks as a percentage of earnings at bottom. Today, buybacks are 54% of earnings. In 2009 they were 79%. From there, the percentage fell, not because buybacks declined but because earnings growth accelerated.

In summary: While the sharp rise in P/E ratios makes the #market look disconnected from reality, history shows this is a normal occurrence in the months following a major cycle low.
Assuming that earnings are bottoming now or soon, valuations should come back down in due course & not at the expense of stock prices. #stocks #market #stockmarket #SPX