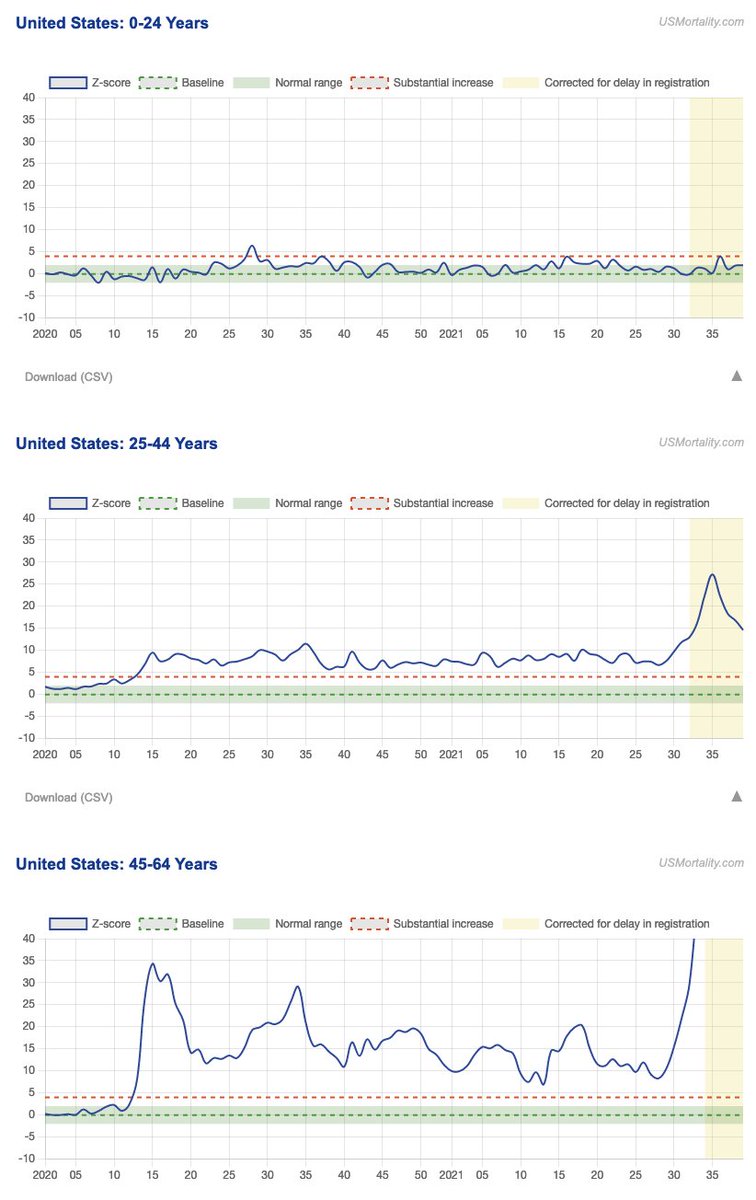
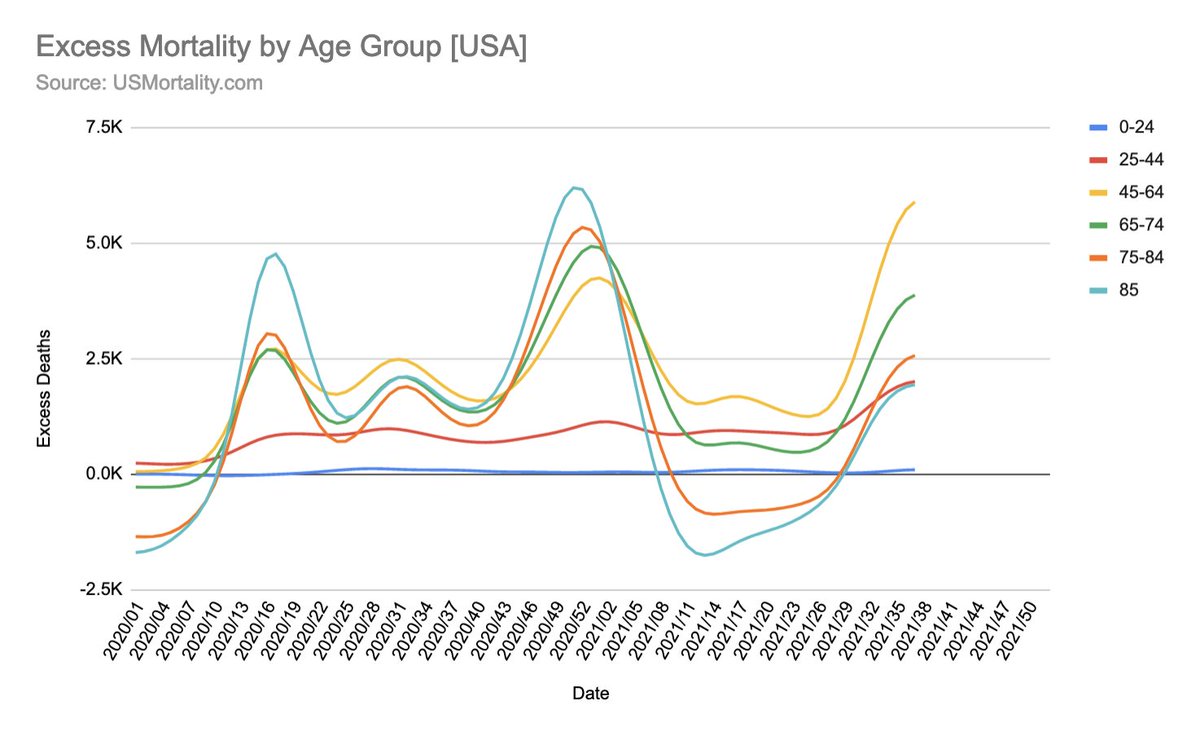
Comparing Excess Deaths and #COVID-19 Deaths (Underlying Cause) Week 1-38, 2020 vs 2021.

Excess Deaths: +33%
COVID-19 Deaths: +50%

In 2020 COVID-19 were 3% lower than excess deaths.
In 2020 +10%!

#COVID19 #CORONAVIRUS #CORONA @justin_hart
Note that both years didn't have any sign. flu deaths, which the baseline contains ('15-'19)!

Calculations here: docs.google.com/spreadsheets/d…
Same chart for the last 12 weeks!

But please note, this is not super reliable yet, as both all-cause excess and covid19 numbers are heavily corrected... (It should be somewhat ballpark reliable though)
We can already see this effect in the data though for two of the bigger states!

• • •

Missing some Tweet in this thread? You can try to force a refresh
 

Keep Current with Ben M.

Ben M. Profile picture

Stay in touch and get notified when new unrolls are available from this author!

Read all threads

This Thread may be Removed Anytime!

PDF

Twitter may remove this content at anytime! Save it as PDF for later use!

Try unrolling a thread yourself!

how to unroll video
  1. Follow @ThreadReaderApp to mention us!

  2. From a Twitter thread mention us with a keyword "unroll"
@threadreaderapp unroll

Practice here first or read more on our help page!

More from @USMortality

13 Oct
New update including week 39 (40), ending 10/02/2021 is up on USMortality.com!

#Covid #Corona #Covid19 #coronavirus
Here by age groups!
Note this is all by z-score... You can find absolute numbers on my website as well!
Here's a map of excess mortality...

We can see the move up to the north...
Read 4 tweets
11 Oct
Just in the last 12 weeks, all-cause excess deaths have been up by 38% compared to the same time frame in 2020. Whatever we are doing, it's not working!

#Covid #Covid19 #Corona #Coronavirus
Let's look at this by age group:

0-24: -49% (Effect of not having lockdowns?)
25-44: +76%
Read 13 tweets
4 Oct
All-cause excess mortality by week for the USA.

Seniors have a 1st dose vaccination coverage of 94%.
Excess mortality still skyrocketed in that age group.

🤔🤔🤔

nytimes.com/interactive/20…

#Covid #Covid19 #Corona #Coronavirus
Seniors are 94% vaxxed and 83% fully vaxxed.

Also remembering the natural immune!
Here all age groups
Read 4 tweets
30 Sep
🚨 Does #Covid19 Vaccination lead to less COVID-19-Like Illness (CLI)?

A test-negative design study with 41,552 participants looked CLI diagnosis, symptomatic illness, and test positivity by vaccination status.

⬇️ Megathread below... ⬇️ Like & RT 🚨
#Covid #Corona #Coronavirus Image
Let's start from the beginning!

A recent study by Thompson et al., which was published in the @NEJM, funded and features by @CDCgov in its weekly MMWR series, looked at COVID-19 Like Illness (CLI) hospitalizations for the age group 50+. ImageImage
The study authors identified over 40k hospitalizations.

These were not all-cause hospitalizations, but CLI diagnosed hospitalizations, which is a subset of all hospitalizations. Time frame: 1/1/21 - 6/22/21.

The below diagram tries to visualize the study sample (red). Image
Read 44 tweets
28 Sep
Spoiler: I’m working on an analysis that is ground breaking and will flip the whole vaccine narrative around!!! Stay tuned, will post tomorrow. Prob one of my best pieces yet!!!
It’s based on official cdc/study data. Bullet proof IMO
Guys, please stay patient. Still working on write up!

Graphs are finished, but we just made another discovery, that needs to be looked into...

Sorry for the delay...

Still hoping to post today
Read 4 tweets
24 Sep
This is from "internal" Israeli report:

Daily tests; It proofs my suspicoun that unvaxxed are tested 70% more than vaxxed.
This heavily skews the VE calculations!
Unfortunately not publicly available, and we also don't even know it by age...

#Covid19 #Covid #Corona #Coronavirus
The original poster has confirmed this to me!

This confirms that the Israeli government is aware of the REAL VE and all Test data by vaxx status; but it is not published - WHY?

Based on this report, the total tests for unvaxxed for this specific calender week made up 53% of total tests.
Unvaxxed that are test eligible (age 3+) only make up 26.7% of the population.
This suggests that unvaxxed are roughly tests 2x as often as vaxxed.
Read 6 tweets

Did Thread Reader help you today?

Support us! We are indie developers!


This site is made by just two indie developers on a laptop doing marketing, support and development! Read more about the story.

Become a Premium Member ($3/month or $30/year) and get exclusive features!

Become Premium

Too expensive? Make a small donation by buying us coffee ($5) or help with server cost ($10)

Donate via Paypal Become our Patreon

Thank you for your support!

Follow Us on Twitter!

:(