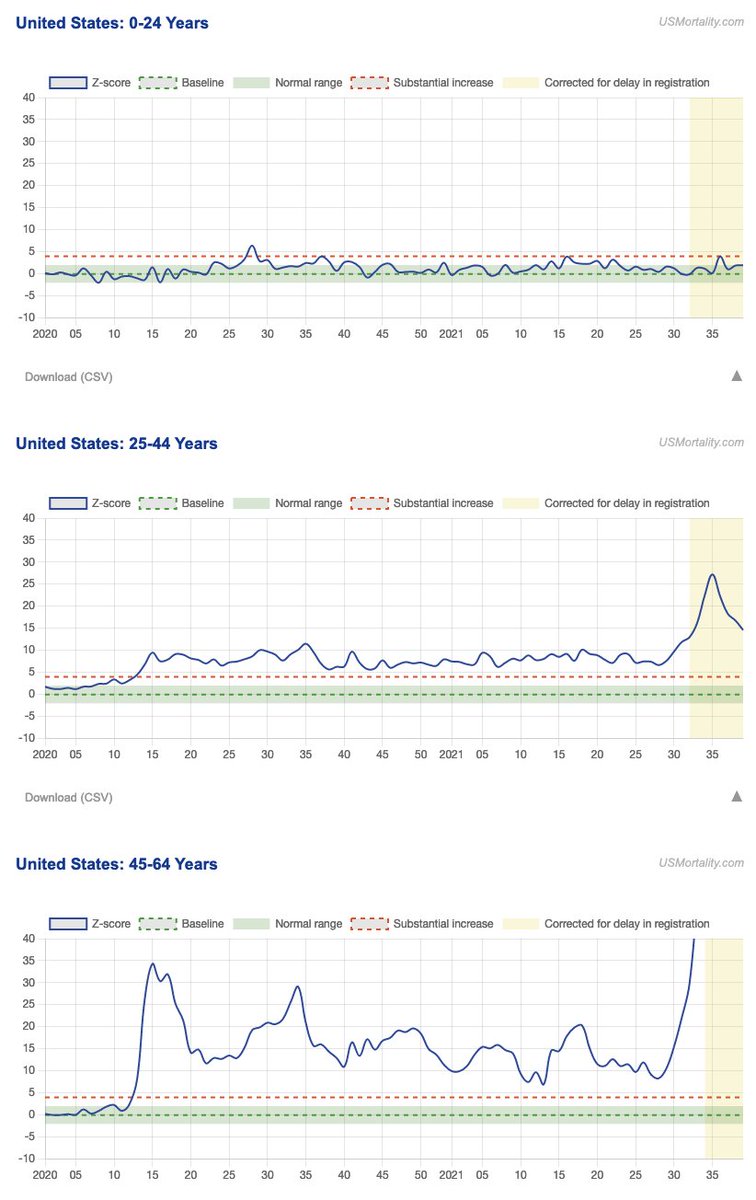
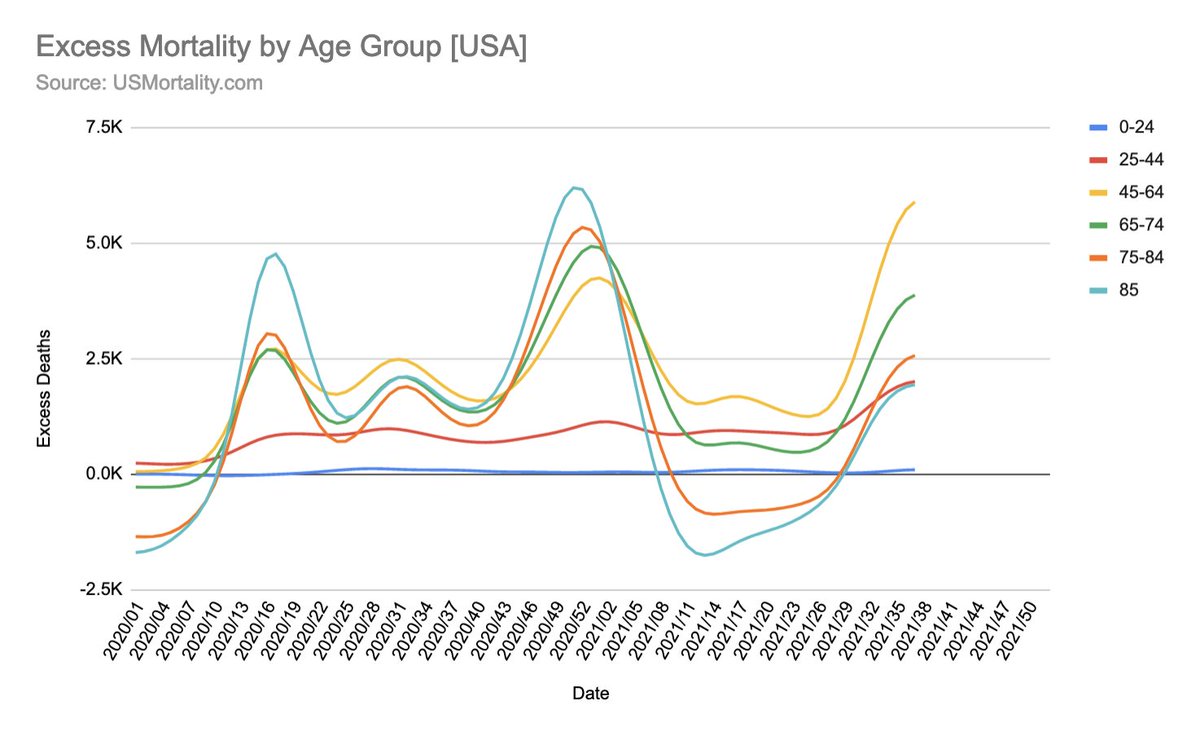
But please note, this is not super reliable yet, as both all-cause excess and covid19 numbers are heavily corrected... (It should be somewhat ballpark reliable though)
Just in the last 12 weeks, all-cause excess deaths have been up by 38% compared to the same time frame in 2020. Whatever we are doing, it's not working!
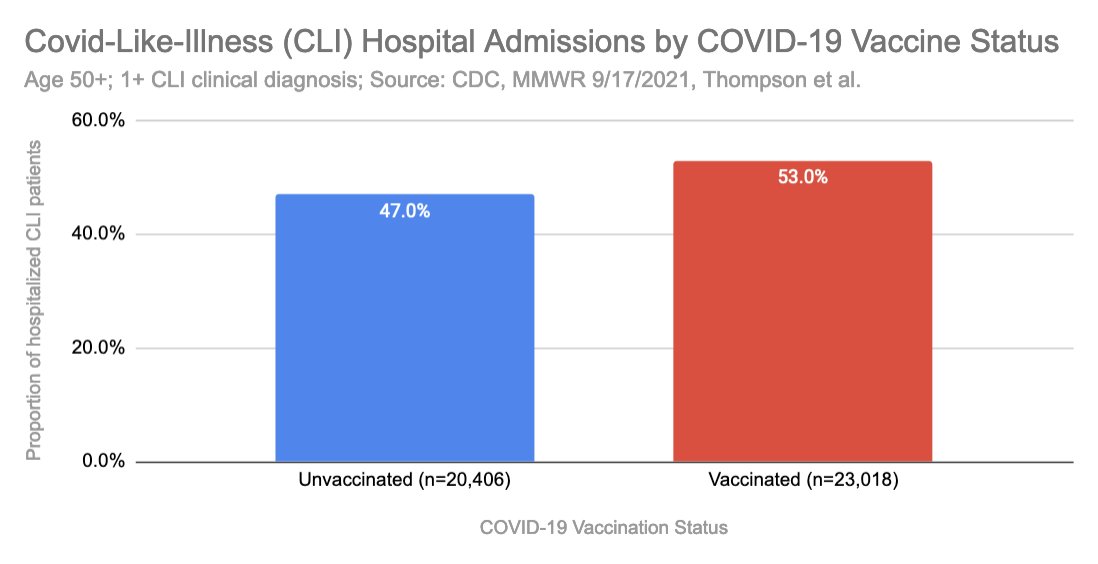
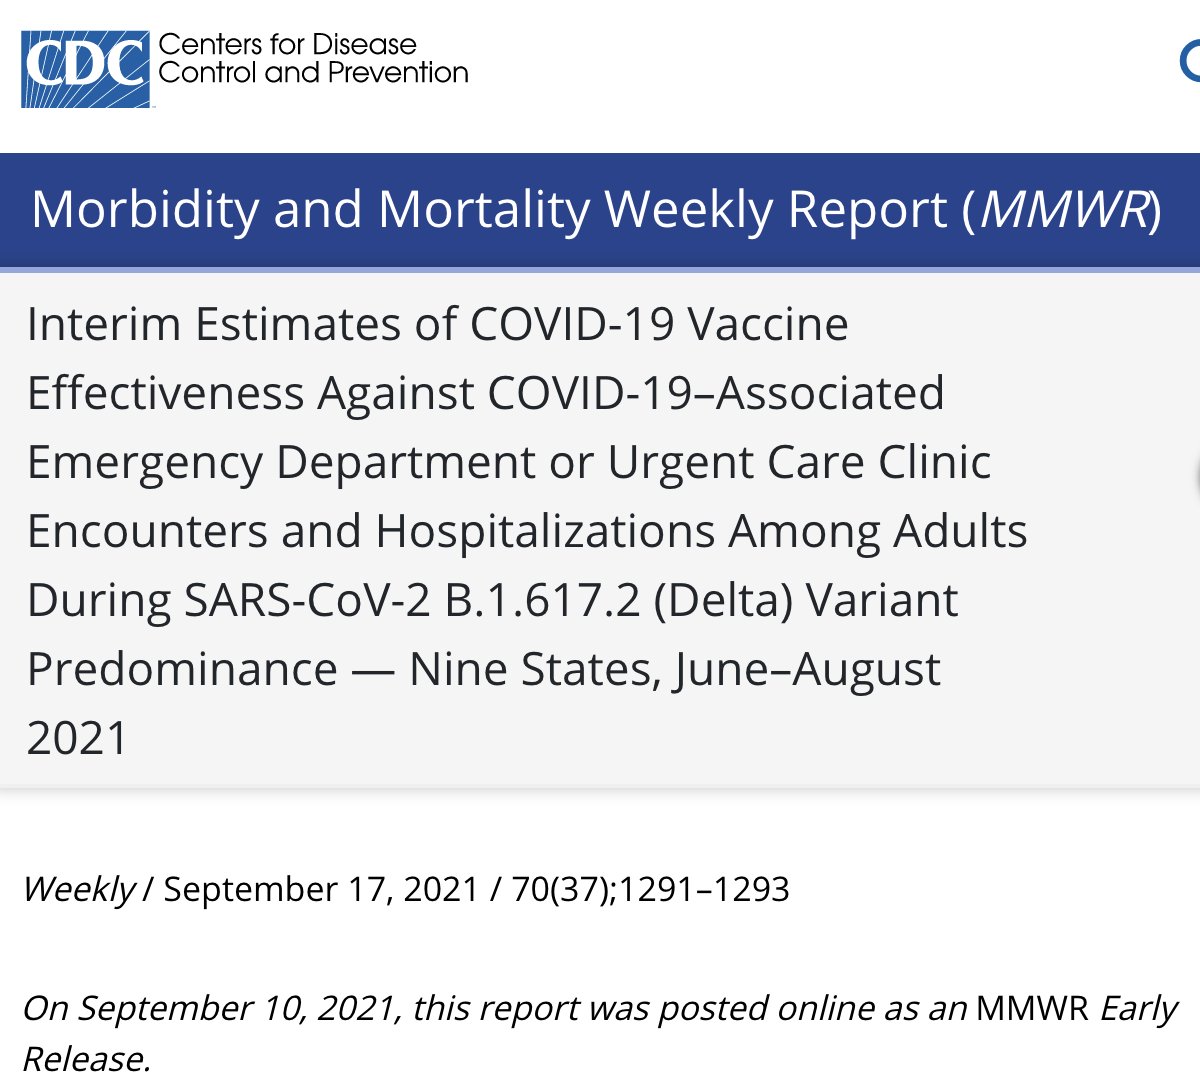
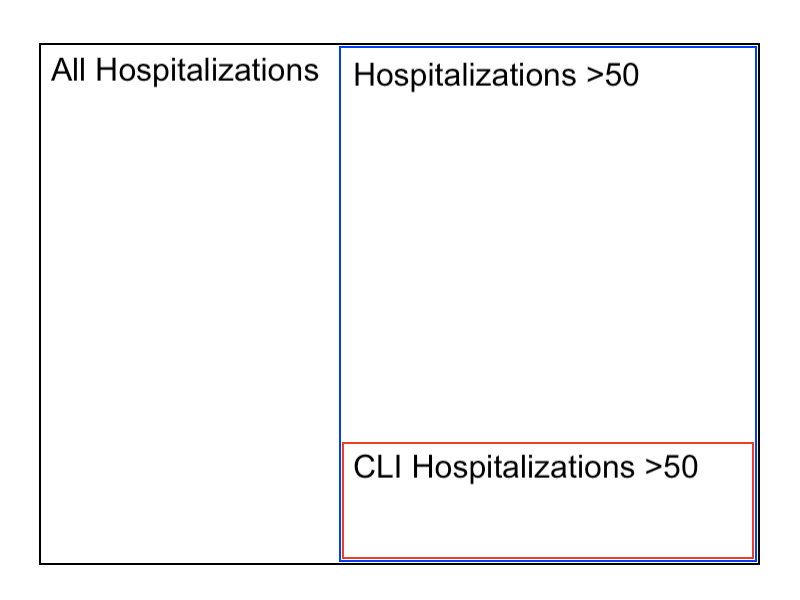
A recent study by Thompson et al., which was published in the @NEJM, funded and features by @CDCgov in its weekly MMWR series, looked at COVID-19 Like Illness (CLI) hospitalizations for the age group 50+.
The study authors identified over 40k hospitalizations.
These were not all-cause hospitalizations, but CLI diagnosed hospitalizations, which is a subset of all hospitalizations. Time frame: 1/1/21 - 6/22/21.
The below diagram tries to visualize the study sample (red).
Spoiler: I’m working on an analysis that is ground breaking and will flip the whole vaccine narrative around!!! Stay tuned, will post tomorrow. Prob one of my best pieces yet!!!
It’s based on official cdc/study data. Bullet proof IMO
Guys, please stay patient. Still working on write up!
Graphs are finished, but we just made another discovery, that needs to be looked into...
Daily tests; It proofs my suspicoun that unvaxxed are tested 70% more than vaxxed.
This heavily skews the VE calculations!
Unfortunately not publicly available, and we also don't even know it by age...
Based on this report, the total tests for unvaxxed for this specific calender week made up 53% of total tests.
Unvaxxed that are test eligible (age 3+) only make up 26.7% of the population.
This suggests that unvaxxed are roughly tests 2x as often as vaxxed.