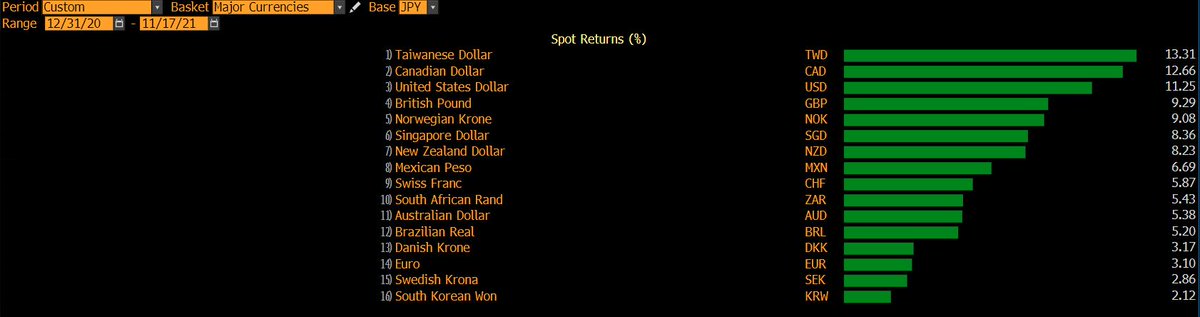
#Dollar (DXY) not driven by #RealRates recently

Since hawkish Jun FOMC, DXY +5.7% v/s 5y US Real yld 23bp lower

Dollar's resilience despite inflation spike in US & despite drop in US real rates further incentivizes foreign investors to buy more $ assets
Basic Maths:
▪️ European investor invests EUR100 ($115 @ 1.1500) in 5y UST at 1.22%
▪️ Gets back ~$122 after 5y
▪️ If converts $ back to EUR at unch 1.1500=>EUR106.25

If $ strengthens to say 1.1000 (w/o FX adjustment despite rocket relative inflation), she gets back ~EUR 111.0
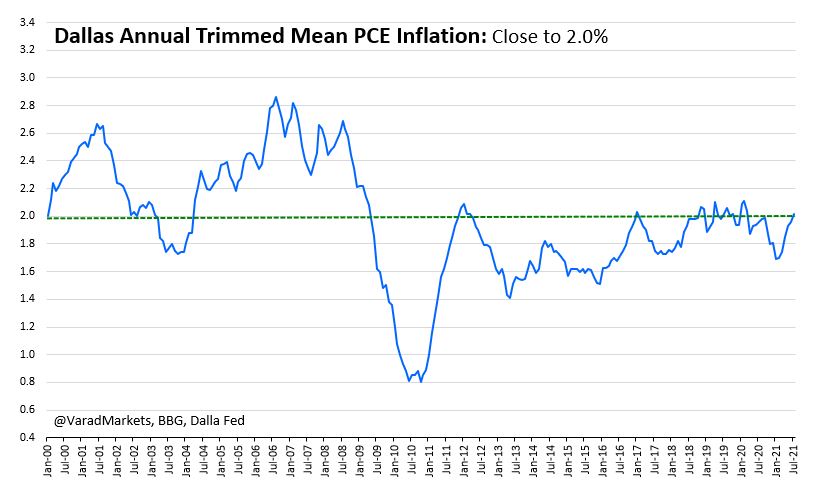
Steep term structure of US Real Rates partly reflecting expected 'transitory-ness' of inflation

• • •

Missing some Tweet in this thread? You can try to force a refresh
 

Keep Current with Varad Markets

Varad Markets Profile picture

Stay in touch and get notified when new unrolls are available from this author!

Read all threads

This Thread may be Removed Anytime!

PDF

Twitter may remove this content at anytime! Save it as PDF for later use!

Try unrolling a thread yourself!

how to unroll video
  1. Follow @ThreadReaderApp to mention us!

  2. From a Twitter thread mention us with a keyword "unroll"
@threadreaderapp unroll

Practice here first or read more on our help page!

More from @VaradMarkets

17 Nov
#JPY & Correlations:
▪️ USDJPY 114.80 ~5yr highs; last seen post Nov'16 Trump election; ~103.5=>118.66 in 5wk
▪️ JPY v/s G10 increased s/t correls=>towards 'Dollar world' (USDJPY ⬆️, AUDUSD ⬇️) v/s Reflation/Risk Off Cross-JPY moves
▪️ Recently JPY-XXX sidelined; may change

1/4
▪️ YTD Long CAD/Short JPY still best G10-JPY Dollar-neutral trade but rise in correls recently
▪️ Since Nov FOMC, JPY-XXX lacklustre; most FX actually weaker vs JPY
▪️ Since Jun FOMC (hawkish pivot), USDJPY best then NZDJPY

SGDJPY a possible short JPY, Dollar-neutral candidate
USDJPY v/s Rates:
▪️ Best & more stable correl with Nominal yld (10yr UST yield ~55% correl then 5y UST then 2y)
▪️ Some correl with Inflation Breakevens (5y BE ~30%)
▪️ Interestingly little correl with Real ylds (5y Real TIPS ~15%)

Caveat: Correl, esp s/t, reasonably volatile
Read 4 tweets
15 Nov
#EUR Crosses & dovish #ECB:
▪️ EURUSD claims next big fig; on 1.13-handle; most FX stronger vs EUR (chart vs Nov FOMC)
▪️ ECB to increase upper limit for cash as collateral for Securities Lending (75 to 150bn)
▪️ LAGARDE: Conditions for rate hike very unlikely to be met 2022

1/8 ImageImage
f/e Euro bond futures lower on doubling of limit to 150bn for cash as collateral=>possible easing of collateral shortage in repo mkt

But last utilization only 15.5bn (Sep monthly avg) & peak daily util 40.8bn (Jun21)

FYG
DU Euro Schatz ~2y
OE - Euro Bobl ~5y
RX - Euro Bund ~10y Image
Lagarde:
▪️ pandemic challenge isn't over yet
▪️ energy >50% of headline inflation
▪️ inflation boost from reversal of German VAT cut to fall out of calculations from Jan22
▪️ wage growth next yr potentially rising somewhat more...but risk of second-round effects remains limited Image
Read 8 tweets
25 Oct
#Fed v/s Markets:
▪️ Mkt now pricing >2 hikes in 2022 vs Fed Dots @ 0.5 hike
▪️ Mkt @ 4 over 23/24 vs Fed 6 hikes
▪️ Mkt @ 18bp 0.7 hike by Jun'22 vs Fed to end taper only by mid-22 implies:
1⃣ Fed to hike with QE-buy (read #Powell 👇) OR
2⃣ Fed to accelerate taper by Mar'22

1/7
#Powell @ Jul-FOMC: "wouldn’t be still buying assets & raising rates...you’re adding accommod by buying & removing by raising.,,wouldn’t be ideal"

Sep-FOMC: "buying assets=adding acco..wouldn’t make any sense to then lift off...would be wiser..to go ahead & speed up taper"

2/7
▪️ Fed starts in Nov21 at $15bn/m; end in 8m in Jun’22
▪️ But even at 5y-avg ~2.0% pa, CPI doesn't fall below 5.0% until Mar22
▪️ Hawkish possibility=>Fed gives up on transitory in Feb22; accelerates taper to $30/m to end in Apr22; first hike by Jun22; that's current mkt pricing
Read 7 tweets
16 Sep
#FOMC: Dive into DOTS
▪️ Besides any tapering ann'ncem't, DOTS or median rate hike projections important at 22 Sep FOMC
▪️ Current DOTS: 2022 (no hike), 2023 (2 hikes), L/T (~10 hikes)
▪️ FOMC to introduce DOTS for 2024 for first time - few calling for 3 rate hikes in 2024

1/9
▪️ Recall: Fed's surprise projection of 2 rate hikes for 2023 was primarily responsible for Jun FOMC's hawkish pivot => DXY spiked ~2% over 2 trading sessions post June FOMC

So worth paying close attention to Sept DOTS to gauge risk-reward better

2/9
3 key DOT variables:

1⃣ 2022 to show a rate hike (current none)? Need 3 FOMC members (out of 18) to flip for median to shift to 1 hike

2⃣ 2023 to show addl hike (current 2 hikes)? Need just 2 members to flip to shift median to 3 hikes - easy ask - shouldn't be surprising

3/9
Read 9 tweets
30 Aug
#US Core #PCE #Inflation:
▪️ Annualizing 4.8% in 2021 vs Fed SEP projection 3.0%
▪️ Last Jul 3.6%. Even if annualizes only 2.5% for rest 2021, full year YoY would still be 3.9%
▪️ Sept FOMC will have to revise higher from 3.0% towards 4.0%
▪️ Can 2022 proj be left at 2.1%? ImageImage
Core PCE MoM past its peak?
- 5y avrg 0.17%
- Post Covid avrg 0.30%
- Post Vaccine avrg 0.39% (since Nov'20)
- Post Covid peak 0.63% (Apr'21)
- Last July print 0.34%

Transitory assumption: will ease towards 0.17-20% MoM into H1'22 (equivalent to 2.0-2.4% YoY) Image
Trimmed Mean Inflation?
▪️ Powell at JH "..to capture whether price increases for particular items are spilling over into broad-based inflation. These include trimmed mean.."
▪️ Excluded: 50 components from lower tail of distribution of monthly price changes & 71 from upper tail ImageImage
Read 4 tweets
4 Aug
#DiveIn: Collapse in Term Premium TP

▪️ TP negative again after being positive for most of 2021
▪️ Excess yield investors require/receive to commit to holding L/T bond instead of series of S/T bonds has turned negative
▪️ Investors now willing to pay extra to hold L/T bonds
1/10
With 10y UST yield at 1.18% & TP at -0.10% => 1y yield is expected to avg ~1.28% over next 10 yrs

Term Premium?
▪️ Compensation investors demand for risk that S/T yields do not evolve as expected
▪️ 10y Nominal = expected path of S/T yield over next 10 yrs + Term Premium TP
2/10
▪️ Negative TP => investors willing to accept lower yield on L/T bond to avoid risks of rolling over their investments in series of S/T bonds with uncertain fluctuating interest rates

Thus higher Rates Volatility usually implies higher TP

Chart: ACM TP v/s MOVE Index
3/10
Read 11 tweets

Did Thread Reader help you today?

Support us! We are indie developers!


This site is made by just two indie developers on a laptop doing marketing, support and development! Read more about the story.

Become a Premium Member ($3/month or $30/year) and get exclusive features!

Become Premium

Too expensive? Make a small donation by buying us coffee ($5) or help with server cost ($10)

Donate via Paypal

Thank you for your support!

Follow Us on Twitter!

:(