07-JAN-2022 UPDATE
1/13
Short but NOT sweet update on #COVID19 hospitalizations in 🇺🇸 children/teens.
National update in this 🧵 with data thru 06-Jan - H/T @JasonSalemi
Visit our interactive dashboard to see data for every state.
#epitwitter #PedsICU
covkidproject.org/hospitalizatio…
1/13
Short but NOT sweet update on #COVID19 hospitalizations in 🇺🇸 children/teens.
National update in this 🧵 with data thru 06-Jan - H/T @JasonSalemi
Visit our interactive dashboard to see data for every state.
#epitwitter #PedsICU
covkidproject.org/hospitalizatio…
07-JAN-2022 UPDATE
2/13
There were 3,142 children 0-17 years old hospitalized with #COVID19 on 06-Jan-2022. This is MORE THAN TWICE as many as were hospitalized on 04-Sept-2021 at the peak of the #DeltaVariant surge.
#OmicronVariant #LongCovidKids
covkidproject.org/hospitalizatio…
2/13
There were 3,142 children 0-17 years old hospitalized with #COVID19 on 06-Jan-2022. This is MORE THAN TWICE as many as were hospitalized on 04-Sept-2021 at the peak of the #DeltaVariant surge.
#OmicronVariant #LongCovidKids
covkidproject.org/hospitalizatio…

07-JAN-2022 UPDATE
3/13
Pediatric bed-days for #COVID19 inpatient hospitalizations of kids 0-17 yrs have now surpassed 400,000.
That is counting only from summer 2020 - first wave hospitalizations of children in spring 2020 are not recorded anywhere.
covkidproject.org/hospitalizatio…
3/13
Pediatric bed-days for #COVID19 inpatient hospitalizations of kids 0-17 yrs have now surpassed 400,000.
That is counting only from summer 2020 - first wave hospitalizations of children in spring 2020 are not recorded anywhere.
covkidproject.org/hospitalizatio…

07-JAN-2022 UPDATE
4/13
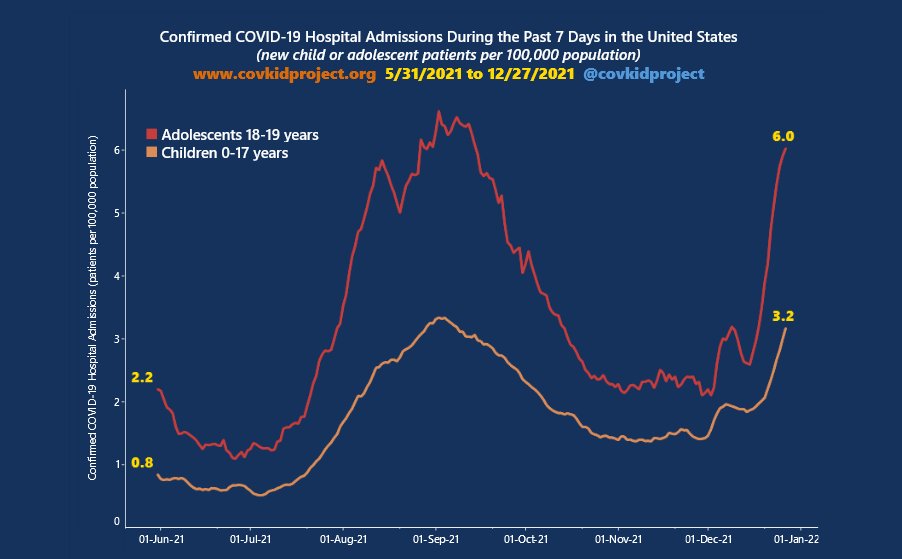
Rates of new hospital admissions of 🇺🇸 children 0-17 yrs and teens 18-19 yrs with #COVID19 are at all-pandemic high levels nationally.
#epitwitter #OmicronVariant #LongCovidKids #PedsICU #Tweetiatrician
covkidproject.org/hospitalizatio…
4/13
Rates of new hospital admissions of 🇺🇸 children 0-17 yrs and teens 18-19 yrs with #COVID19 are at all-pandemic high levels nationally.
#epitwitter #OmicronVariant #LongCovidKids #PedsICU #Tweetiatrician
covkidproject.org/hospitalizatio…

07-JAN-2022 UPDATE
5/13
View our #COVID19 dashboard on a larger screen to find state-specific current hospitalizations and new admissions for children and teens.
These data are reported by every hospital in the nation to @HHSGov on a daily basis.
covkidproject.org/hospitalizatio…
5/13
View our #COVID19 dashboard on a larger screen to find state-specific current hospitalizations and new admissions for children and teens.
These data are reported by every hospital in the nation to @HHSGov on a daily basis.
covkidproject.org/hospitalizatio…


07-JAN-2022 UPDATE
6/13
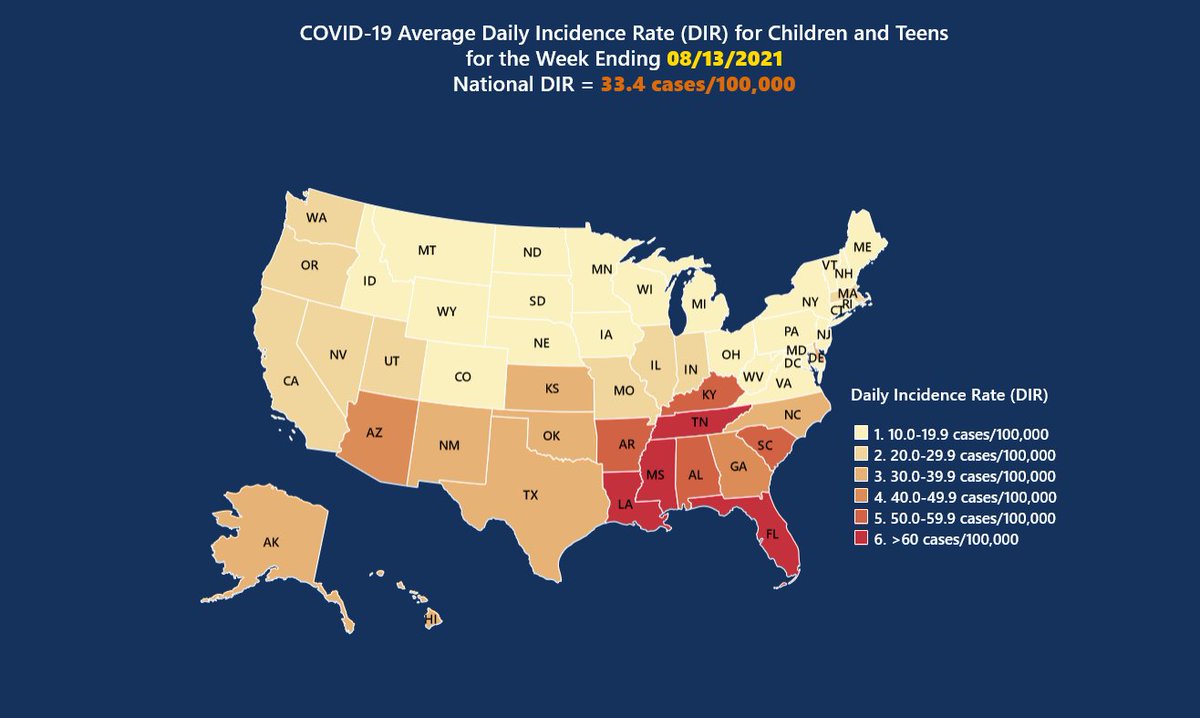
Maps of new #COVID19 hospital admission rates for children and teens reveal high rates are spreading beyond New York, Florida, and the eastern seaboard.
#epitwitter #PedsICU #Tweetiatrician
covkidproject.org/hospitalizatio…
6/13
Maps of new #COVID19 hospital admission rates for children and teens reveal high rates are spreading beyond New York, Florida, and the eastern seaboard.
#epitwitter #PedsICU #Tweetiatrician
covkidproject.org/hospitalizatio…


07-JAN-2022 UPDATE
7/13
Remember our understanding of the clinical spectrum of #OmicronVariant infections in children is still nascent. #SARSCoV2 is a multisystem pathogen with known derangement of neurological, cardiovascular, and endocrine physiology.
7/13
Remember our understanding of the clinical spectrum of #OmicronVariant infections in children is still nascent. #SARSCoV2 is a multisystem pathogen with known derangement of neurological, cardiovascular, and endocrine physiology.
https://twitter.com/COVKIDProject/status/1479541894011146242?s=20
07-JAN-2022 UPDATE
8/13
Thank you for sharing these #COVID19 hospitalization data for kids 🙏
@AAPPres
@aetiology
@akjohnson1922
@AmerAcadPeds
@areinamo21
@Arrianna_Planey
@ashishkjha
@aslavitt
@astho
@BexzieGarcia
@ChandyJohnLab
@ChomiloMD
@ChrisCarrollMD
8/13
Thank you for sharing these #COVID19 hospitalization data for kids 🙏
@AAPPres
@aetiology
@akjohnson1922
@AmerAcadPeds
@areinamo21
@Arrianna_Planey
@ashishkjha
@aslavitt
@astho
@BexzieGarcia
@ChandyJohnLab
@ChomiloMD
@ChrisCarrollMD
07-JAN-2022 UPDATE
9/13
Thank you for sharing these #COVID19 hospitalization data for kids 🙏
@Cleavon_MD
@COVIDBLK
@DataDrivenMD
@DeannaMarie208
@denise_dewald
@dgurdasani1
@Dr_ScottK
@DrEricDing
@drkomanduri
@DrLeanaWen
@DrLindaMD
@DrPanMD
@DrSriram
@DrStager
@DrSteveCook
9/13
Thank you for sharing these #COVID19 hospitalization data for kids 🙏
@Cleavon_MD
@COVIDBLK
@DataDrivenMD
@DeannaMarie208
@denise_dewald
@dgurdasani1
@Dr_ScottK
@DrEricDing
@drkomanduri
@DrLeanaWen
@DrLindaMD
@DrPanMD
@DrSriram
@DrStager
@DrSteveCook
07-JAN-2022 UPDATE
10/13
Thank you for sharing these #COVID19 hospitalization data for kids 🙏
@DrTomFrieden
@DrTomori
@DrZoeHyde
@elliemargolis
@EpiEllie
@EricTopol
@ForlornTheresa
@GabrielScally
@gbosslet
@gradydoctor
@GYamey
@heather_haq
@hospitals4kids
@JanelleMMenard
10/13
Thank you for sharing these #COVID19 hospitalization data for kids 🙏
@DrTomFrieden
@DrTomori
@DrZoeHyde
@elliemargolis
@EpiEllie
@EricTopol
@ForlornTheresa
@GabrielScally
@gbosslet
@gradydoctor
@GYamey
@heather_haq
@hospitals4kids
@JanelleMMenard
07-JAN-2022 UPDATE
11/13
Thank you for sharing these #COVID19 hospitalization data for kids 🙏
@JasonSalemi
@JennaMillerKC
@JHowardBrainMD
@jljcolorado
@JPHMPDirect
@KateClancy
@KimberlyPrather
@KYT_ThatsME
@LauraMiers
@LeeBeers
@LongCovidKids
@Michigan_Noah
@NACCHOalerts
11/13
Thank you for sharing these #COVID19 hospitalization data for kids 🙏
@JasonSalemi
@JennaMillerKC
@JHowardBrainMD
@jljcolorado
@JPHMPDirect
@KateClancy
@KimberlyPrather
@KYT_ThatsME
@LauraMiers
@LeeBeers
@LongCovidKids
@Michigan_Noah
@NACCHOalerts
07-JAN-2022 UPDATE
12/13
Thank you for sharing these #COVID19 hospitalization data for kids 🙏
@nonprofitorgs
@npdcoalition
@pccm_doc
@PeterHotez
@PIPSQC
@PublicHealth
@RheaBoydMD
@rwjf
12/13
Thank you for sharing these #COVID19 hospitalization data for kids 🙏
@nonprofitorgs
@npdcoalition
@pccm_doc
@PeterHotez
@PIPSQC
@PublicHealth
@RheaBoydMD
@rwjf
07-JAN-2022 UPDATE
13/13
Thank you for sharing these #COVID19 hospitalization data for kids 🙏
@SapnaKmd
@SuzeQKnits
@Theresa_Chapple
@uche_blackstock
@WesElyMD
@WhitneyEpi
@yaneerbaryam
@yoncabulutmd
@yoreekoh
13/13
Thank you for sharing these #COVID19 hospitalization data for kids 🙏
@SapnaKmd
@SuzeQKnits
@Theresa_Chapple
@uche_blackstock
@WesElyMD
@WhitneyEpi
@yaneerbaryam
@yoncabulutmd
@yoreekoh
• • •
Missing some Tweet in this thread? You can try to
force a refresh