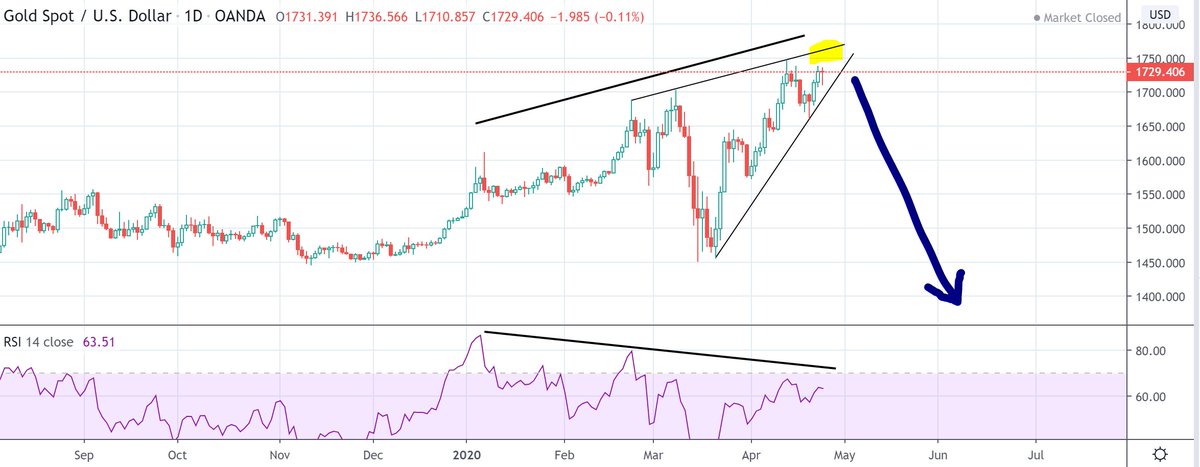
On Wednesday, we got a CPI print of 7% over the duration of a year. Fastest since 1982! Surely, everybody can see, that #inflation is here to stay!?

NO!

WHY?

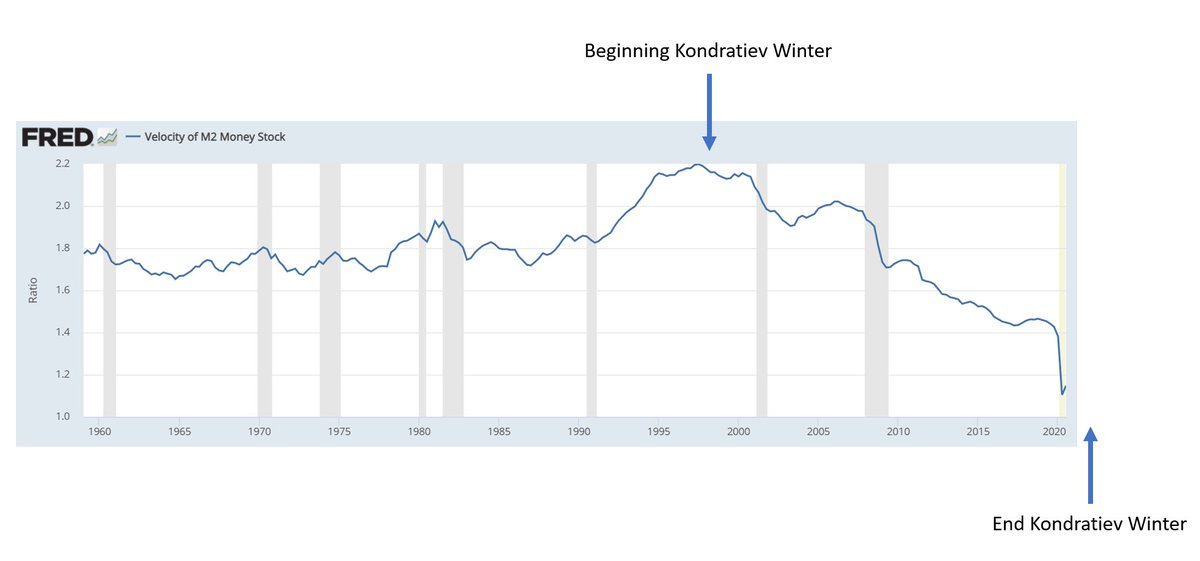
Because of the real gauges of inflation which tells us, that current inflation is due to Supply and Demand issues!
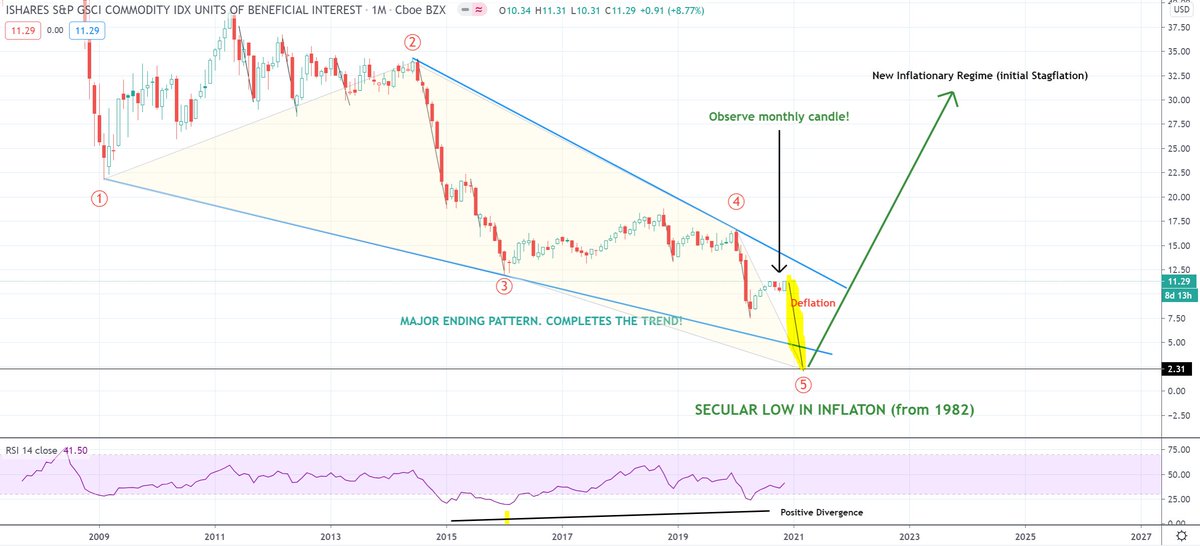
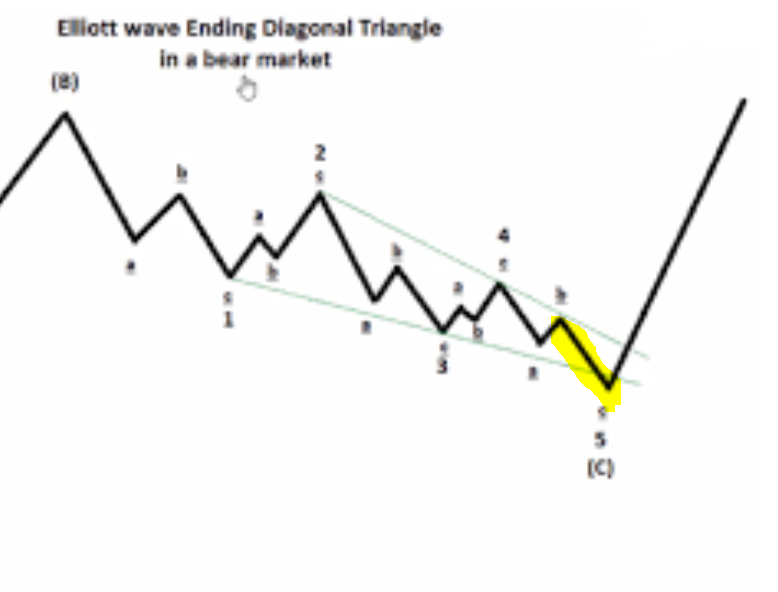
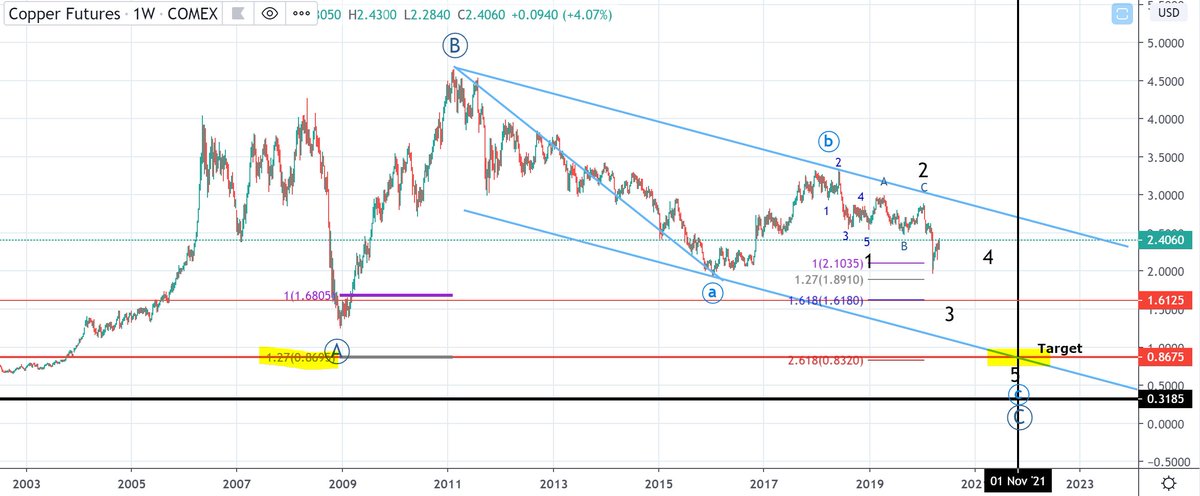
Gold Miners will soar, when REAL ECONOMIC INFLATION is here. For now, they are dead in the water - which is 100% in line with Elliott Wave predictions. "Wave C" is unfolding in 5 waves down. As surplus demand is being flushed from the system, Deflation will reemerge
Beautiful chart for GDX. Observe top in 2011 and nice decline into wave A. Then a clear ABC-correction into top in 2020, before Miners again have started a decline. Observe top in 2020! Right at 61.8% fib. Beautiful! 😉
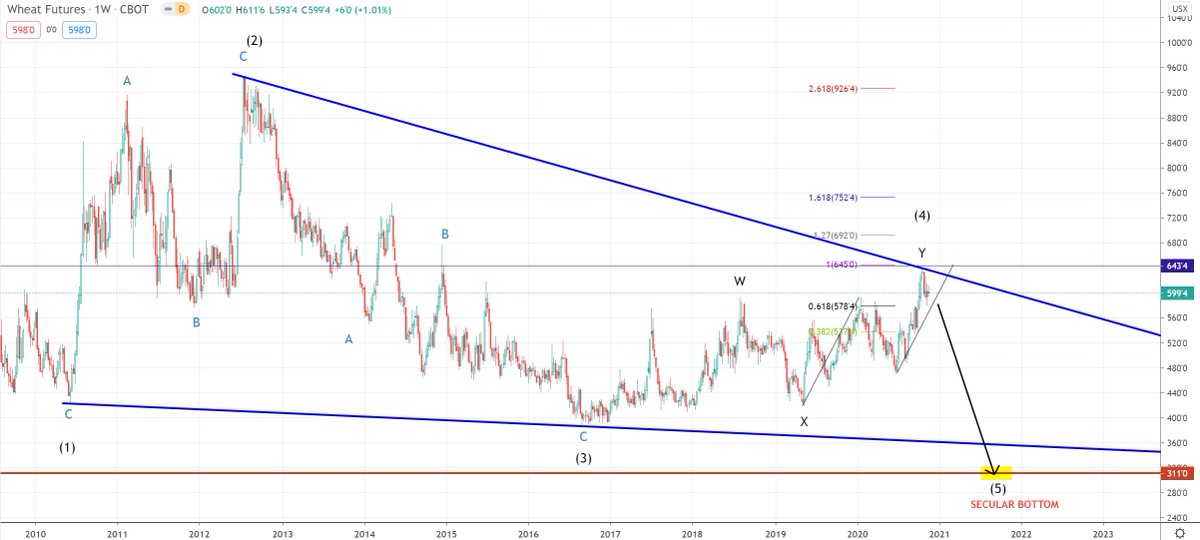
Decline in wave C should take us just below bottom from 2015
So WHY should we see this decline? Because REAL INFLATION is not here. We see abnormality as S-D is out of sync pushing temp. inflation up. This will solve itself and meanwhile #Fed is now getting scared and hawkish! These 2 combined effects will cause MAJOR DEFLATIONARY BUST
So steer clear of the inflation chit-chat - and observe the charts. We will see a major deflationary bust, as #Fed will hugely overreact due to the current inflation spike. This MONETARY POLICY MISTAKE, WILL CRUSH MARKETS. Take care!!
But.... Not yet! We are not at the Bust Top yet! We are about to see markets take off in another push higher into a epic top in this EVERYTHING BUBBLE!
Emerging Markets (as example) give us this perspective!
Stay tuned on TheZebergReport.com

• • •

Missing some Tweet in this thread? You can try to force a refresh
 

Keep Current with Henrik Zeberg

Henrik Zeberg Profile picture

Stay in touch and get notified when new unrolls are available from this author!

Read all threads

This Thread may be Removed Anytime!

PDF

Twitter may remove this content at anytime! Save it as PDF for later use!

Try unrolling a thread yourself!

how to unroll video
  1. Follow @ThreadReaderApp to mention us!

  2. From a Twitter thread mention us with a keyword "unroll"
@threadreaderapp unroll

Practice here first or read more on our help page!

More from @HenrikZeberg

10 Jan 21
@RaoulGMI Good Morning! You asked what is happening to #Gold and #Silver. This is my take - a summary of the governing Thesis on TheZebergReport.com for a long time! Hope you can use the input! 🙋‍♂️🙂
Since ~2000 we have been in Kondratiev's Winter. A period where GLOBAL DEBT causes low and falling growth rates. Central banks try to counter this by printing money (Monetary Stimulus). However, Deflationary forces from debt causes deflations to unfold - despite extreme measures
To the frustration of Central Banks, they cannot create inflation despite extreme money printing. They stimulate by infusing money into the system but cannot make the money circulate. Velocity drops dramatically. What they miss...You cannot solve a solvency problem with Liquidity
Read 14 tweets
22 Nov 20
Why do I think #Gold, #Bitcoin are about to tumble? Because of my cross-market-analyses approach with >100 charts pointing to a deflationary bust AND the Elliott Wave structures for Gold, Bitcoin and USD. Let's try investigate 1) Deflationary Thesis and 2) Elliott Wave-structures
The Deflationary Thesis is due to the patterns shaping up in all commodities. Commodities drive inflation. First GSCI Commodity Index - a very clear Ending Diagonal Triangle (Descending Wedge). Calls for DEFLATIONARY BUST before MAJOR SECULAR BOTTOM. TheZebergReport.com
#Wheat which is part of #Commodities setting direction for Inflation. Same pattern! Descending Wedge. Calls for Deflationary Bust - before Major SECULAR BOTTOM. Deflation before New Inflationary Regime! TheZebergReport.com
Read 22 tweets
24 Aug 20
Dear all. Please read following: My friend @officialwazzan is looking for software developers to join his startup pofty.com
👉 an ecosystem for labour and services, serving every professional and every profession (the legal ones of 😁)
....Thread 👇👉
👉Ecosystem for physical and virtual labour and services
👉 All professions, not just an area or a niche
👉For the wide use, no boring categories or questionnaires just down to the point
👉Searching for senior developers for equity in return
👉Developers who are experienced with:
Swift(IOS), MySQL(or other DBs), Ruby on Rails, Python Flask, Java, Good with API, Mentality of a founder
Read 4 tweets
9 May 20
These are the "events" we experience during Kondratiev's Winter. We have seen some of these but they will play out a range of times. First in 2000-03, then worse during 2007-09 and now the big one 2020-23(?). Some major dominoes are about to fall - before we reach end of Winter
Major events still to be seen (apart from rest which will be repeated and become much worse than before!): 1) Pension fund crisis 2) Run from paper money 3) War (hope not!) 4) Debt resolution (Monetary Reset?). We are NO where near end of this major crisis, which ends K's Winter
My LT #Copper chart tells me, that we may very well see the crisis (with various phases) continue until end-21 or beginning of '22. That is for the bottom in the economic activity which means, that repercussions may be felt way into 2023-25. No where near the end of this crisis!
Read 19 tweets
30 Apr 20
Some investors, analysts seem to think, that #Equity Bear Market is over and we will rally to ATH. Imo this is naive taking the severe blow to economy into consideration - and the size of the equity bubble which has burst. Some comparisons to earlier Bear Markets provide heads-up
First, Bear Market 2000-02. Rather mild recession due to burst of IT-bubble (somewhat confined) despite extreme Market Cap. to GDP of ~141%. Monetary stimulus had effect as Fed Funds rate >6% at entry of crisis. Still Bear Market for ~638 days and decline of ~50% before bottom
Second, Great Recession 2007-09. Strong recession. Close to Financial World collapse driven by Housing bubble bust. Market Cap. to GDP only at 109%. Monetary stimulus opp. were stretched - QE was introduced. Yet Bear Market for ~517 days with a ~57% decline in stock market value.
Read 6 tweets
25 Apr 20
This is a MASSIVELY Bearish pattern. No question about it! #Gold can rally higher from here (yellow) or it can break from here. But there is nothing Bullish about this. And the speed by which this will be resolved.... whoa!! The resolve is for entire correctional move since 2015!
And we have this for US 10 yr. Bullish C wave coming!
And we have this MASSIVE Bear Flag (wave IV) since 2015 on GDX. Gold will crash!
Read 4 tweets

Did Thread Reader help you today?

Support us! We are indie developers!


This site is made by just two indie developers on a laptop doing marketing, support and development! Read more about the story.

Become a Premium Member ($3/month or $30/year) and get exclusive features!

Become Premium

Too expensive? Make a small donation by buying us coffee ($5) or help with server cost ($10)

Donate via Paypal

Or Donate anonymously using crypto!

Ethereum

0xfe58350B80634f60Fa6Dc149a72b4DFbc17D341E copy

Bitcoin

3ATGMxNzCUFzxpMCHL5sWSt4DVtS8UqXpi copy

Thank you for your support!

Follow Us on Twitter!

:(