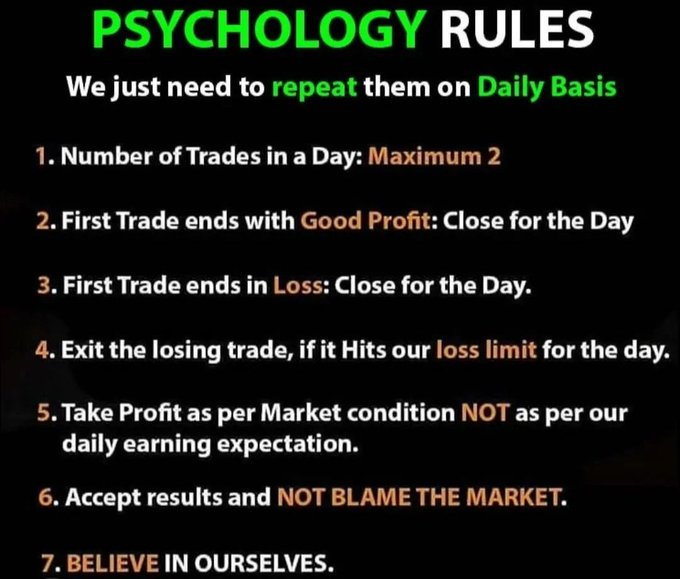
Tips for Intraday Trading: A thread 🧵
Below are a few tips for intraday trading in the Indian share market which will help investors in making the right decision👇👇
#LearnToday #StockMarket
#Nifty #sensex #banknifty
@nakulvibhor @nishkumar1977 @KommawarSwapnil
Below are a few tips for intraday trading in the Indian share market which will help investors in making the right decision👇👇
#LearnToday #StockMarket
#Nifty #sensex #banknifty
@nakulvibhor @nishkumar1977 @KommawarSwapnil

Choose Two or Three Liquid Shares"
Intraday trading involves squaring open positions before the end of the trading session. This is why it is recommended to choose two or three large-cap shares that are highly liquid.
Intraday trading involves squaring open positions before the end of the trading session. This is why it is recommended to choose two or three large-cap shares that are highly liquid.
Determine Entry and Target Prices:
Before placing the buy order, you must determine your entry-level and target price. It is common for a person’s psychology to change after purchasing the shares. As a result, you may sell even if the price sees a nominal increase.
Before placing the buy order, you must determine your entry-level and target price. It is common for a person’s psychology to change after purchasing the shares. As a result, you may sell even if the price sees a nominal increase.
Utilizing Stop Loss for Lower Impact:
Stop loss is a trigger that is used to automatically sell the shares if the price falls below a specified limit. This is beneficial in limiting the potential loss for investors due to the fall in the stock prices.
Stop loss is a trigger that is used to automatically sell the shares if the price falls below a specified limit. This is beneficial in limiting the potential loss for investors due to the fall in the stock prices.
Book Your Profits when Target is reached:
Most day traders suffer from fear or greed. It is important for investors to not only cut their losses, but also to book their profits once the target price is reached.
Learn more & get Experts trading ideas
tinyurl.com/vobqkuw
Most day traders suffer from fear or greed. It is important for investors to not only cut their losses, but also to book their profits once the target price is reached.
Learn more & get Experts trading ideas
tinyurl.com/vobqkuw
Avoid being an Investor:
Intraday trading, as well as investing, requires individuals to purchase shares. However, factors for both these strategies are distinct. One kind adopts fundamentals while the other considers the technical details.....
Intraday trading, as well as investing, requires individuals to purchase shares. However, factors for both these strategies are distinct. One kind adopts fundamentals while the other considers the technical details.....
It is common for day traders to take delivery of shares in case the target price is not met. He or she then waits for the price to recover to earn back his or her money. Its not recommended because the stock may not be worthy of investing, as it was bought for a shorter duration.
Research your Wish list thoroughly:
Investors are advised to include eight to 10 shares in their wish lists and research these in depth. Knowing about corporate events, such as mergers, bonus dates, stock splits, dividend payments, etc., along with their technical levels
Investors are advised to include eight to 10 shares in their wish lists and research these in depth. Knowing about corporate events, such as mergers, bonus dates, stock splits, dividend payments, etc., along with their technical levels
Learn more & get Experts trading ideas with AngelOne
tinyurl.com/vobqkuw
#trading
#TradingView
#tradingpsychology
#TradingSignals
#nifty50 #BANKNIFTY
tinyurl.com/vobqkuw
#trading
#TradingView
#tradingpsychology
#TradingSignals
#nifty50 #BANKNIFTY
• • •
Missing some Tweet in this thread? You can try to
force a refresh


