NEW REPORT about Americans' views on gender identity and #trans issues is out now. This data is from a survey of over 3,000 adults conducted last fall. Here's what we found. (1/8) #LGBTQ#Transgenderism
True or false: "Transgender women are biological women." About one in four zoomers said "true." The majority of people said "false," regardless of age. (2/8)
Same question broken down by political orientation. The majority of respondents within each category said "false." Over a third of adults who identified as "very liberal" said "true." (3/8)
How much do you agree or disagree: "Teachers should teach their students about gender identity and sexual orientation in elementary school." About half of surveyed zoomers and millennials agreed to some extent. (4/8)
Same question broken down by political orientation. Over 72% of "very liberal" adults agreed to some extent compared to only about 20% of those who identified as "conservative." The "very liberal" group was relatively much more likely to *strongly* agree with the statement. (5/8)
How much do you agree or disagree: "I believe that biological males who identify as women should be allowed to compete in women's sports." The majority of respondents in each generational cohort disagreed to some extent. (6/8)
Same question broken down by political orientation. "Very liberal" respondents were far more likely to strongly agree compared to other groups, even those identifying as "liberal." Interestingly, "very conservative" adults agreed more than "conservative" ones. (7/8)
If data like this interests you, please support our work by sharing our findings. We are an #antipartisan research team. Full freely accessible report: buff.ly/3ZNg0YB More reports from our 2022 survey are coming soon! (8/8)
• • •
Missing some Tweet in this thread? You can try to
force a refresh
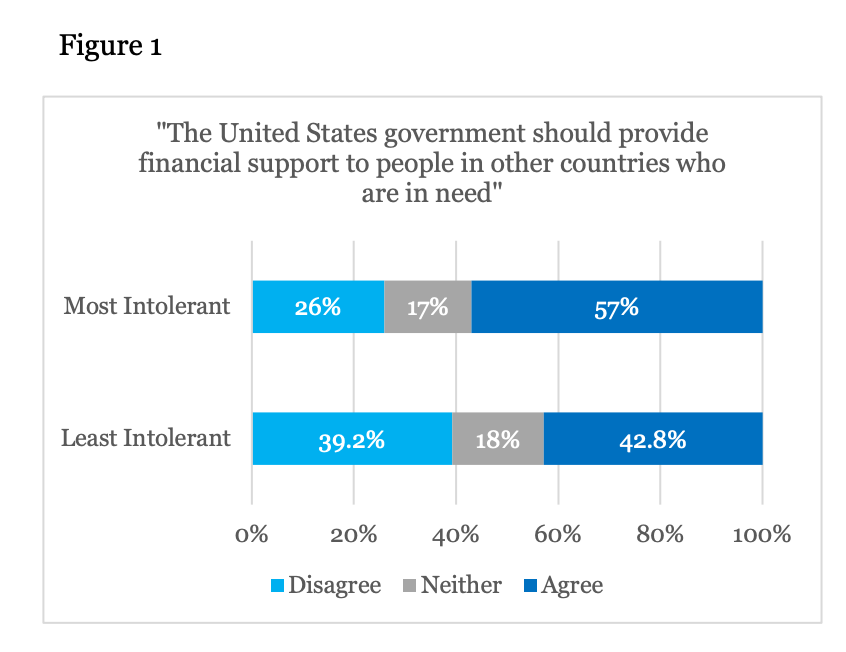
We asked people how irritated they'd be if a member of their most opposed political party was dating a member of their family, their neighbor, co-worker, or local elected official.
Avg answer = tolerance score. We limited this sample to most and least tolerant.
We asked over 3,000 Americans about the impact of European settlers (Part 1), racial minorities' ability to succeed in the U.S. (Part 2), and whether it's shameful to be white (Part 3).
Here are our results for Part 2 🧵
How much do you agree: "Racial minorities in the U.S. have no hope for success because of racism."
Agreement by race.
Black respondents were more than twice as likely as white respondents to agree with the statement to some extent.
How much do you agree: "Racial minorities in the U.S. have no hope for success because of racism."
Agreement by educational attainment.
About a third of college graduate level respondents agreed to some extent compared to around half of high school level respondents.
We asked over 3,000 Americans about the impact of European settlers (Part 1), racial minorities' ability to succeed in the U.S. (Part 2), and whether it's shameful to be white (Part 3).
Here are our results for Part 1 🧵
How much do you agree: "Prior to the arrival of the European settlers, Native American/ Indigenous tribes lived in peace and harmony."
Results by race.
About 75% of black respondents agreed to some extent compared to around 45% of white respondents.
How much do you agree: "Prior to the arrival of the European settlers, Native American/ Indigenous tribes lived in peace and harmony."
Agreement by educational attainment.
About 50% or more of every educational group agreed to some extent.
"Which political group do you think is most different/opposed to your own political views?"
We limited the sample to Republicans and Democrats who selected either the Republican or Democratic parties (N=474).
Political Intolerance
We asked people how irritated they'd be if a member of the political party they most opposed was dating a member of their family, their neighbor, co-worker, or local elected official.
We then averaged their answers to get an overall tolerance score.