Thread
Everyone, here's a couple of quick examples and a guide on how GIS analysis can help in narrowing down areas for geolocation. This will require more than just Google Earth, I'm using ArcMap but free programs like QGIS should be fine.
Everyone, here's a couple of quick examples and a guide on how GIS analysis can help in narrowing down areas for geolocation. This will require more than just Google Earth, I'm using ArcMap but free programs like QGIS should be fine.
Firstly, there are those pesky issues of hills. The first example is going to show you how to narrow down a 'Point 740', to a more limited list of possibilities. Those points and hills are generally named after their elevation and that's our key. Terrain analysis 2/
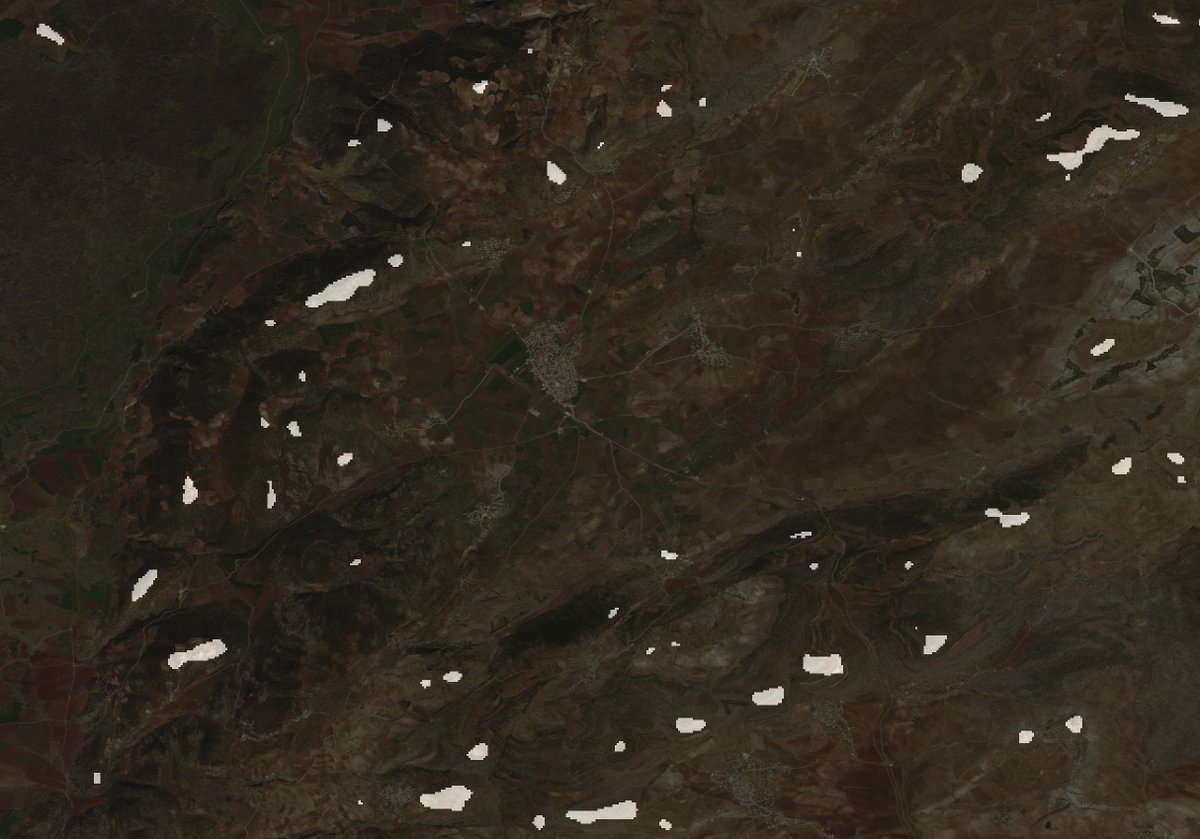
The first step is to download a DEM (elevation model), I generally use the STRM 1sec data from earthexplorer.usgs.gov. It's pretty self explanatory the site. Here's what one should look like 3/ 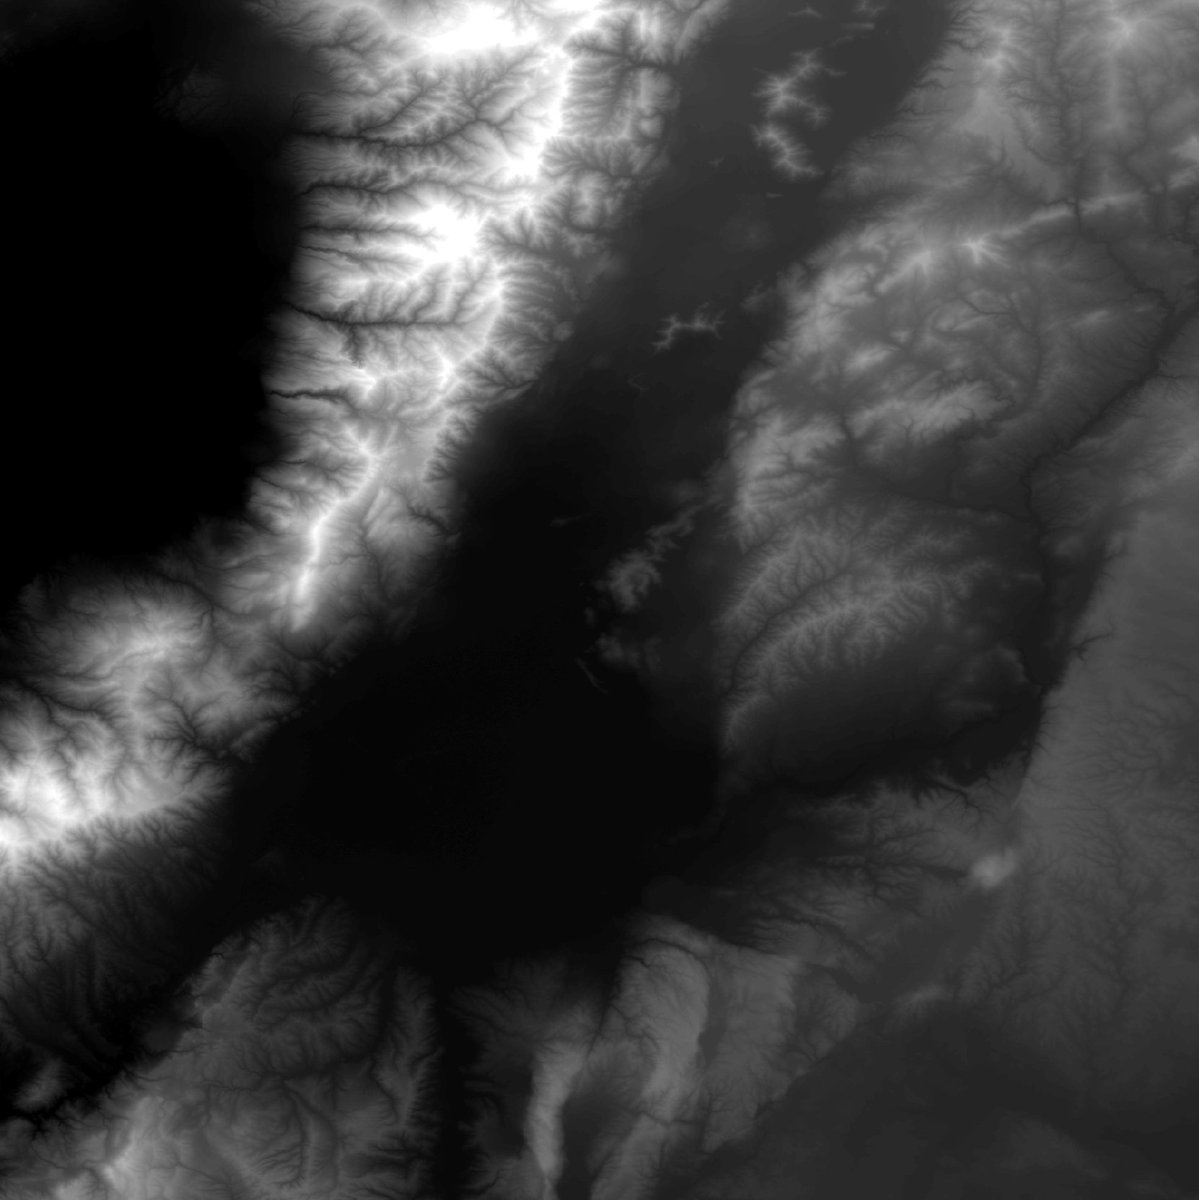
In that map, white colours represent higher areas. So zoom to where you expect the point to be. From there the key is to find prominent areas of terrain that stick out (ie are hilltops). You do this by comparing a more detailed DEM to a averaged one. 4/
To remove noise and make it more smooth the way I do that is by averaging the value using a 5x5px moving window, and another using a 20x20px window eg. The 2nd and 3rd photo show the 5x5 and 20x20 values compared. 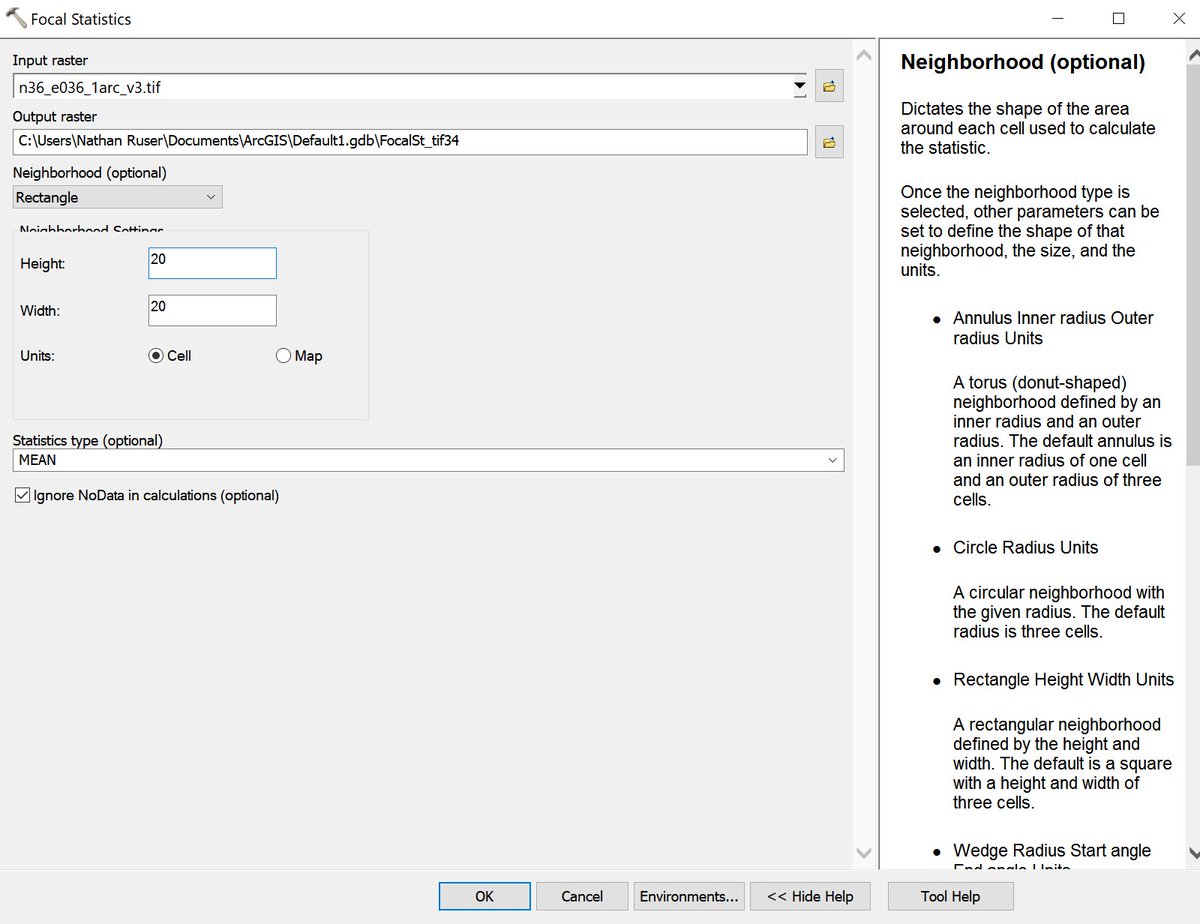


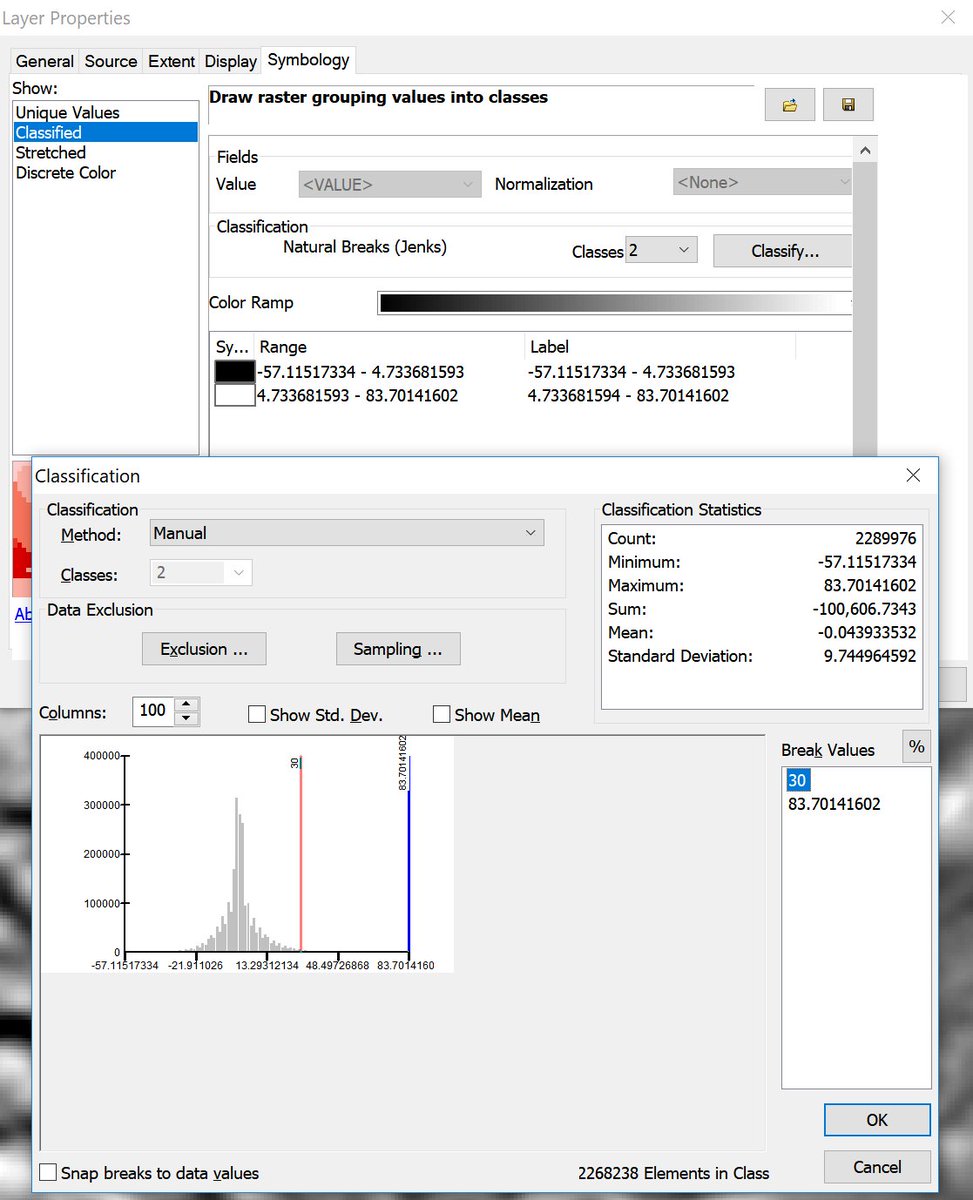
By simply subtracting one from the other you can see the areas which are hilltops and which are valleys (there are other ways to do this such as curvature analysis but this is simpler), the pick a 'cut-off' point for hilltops, I go for the end of the normal histogram 6/ 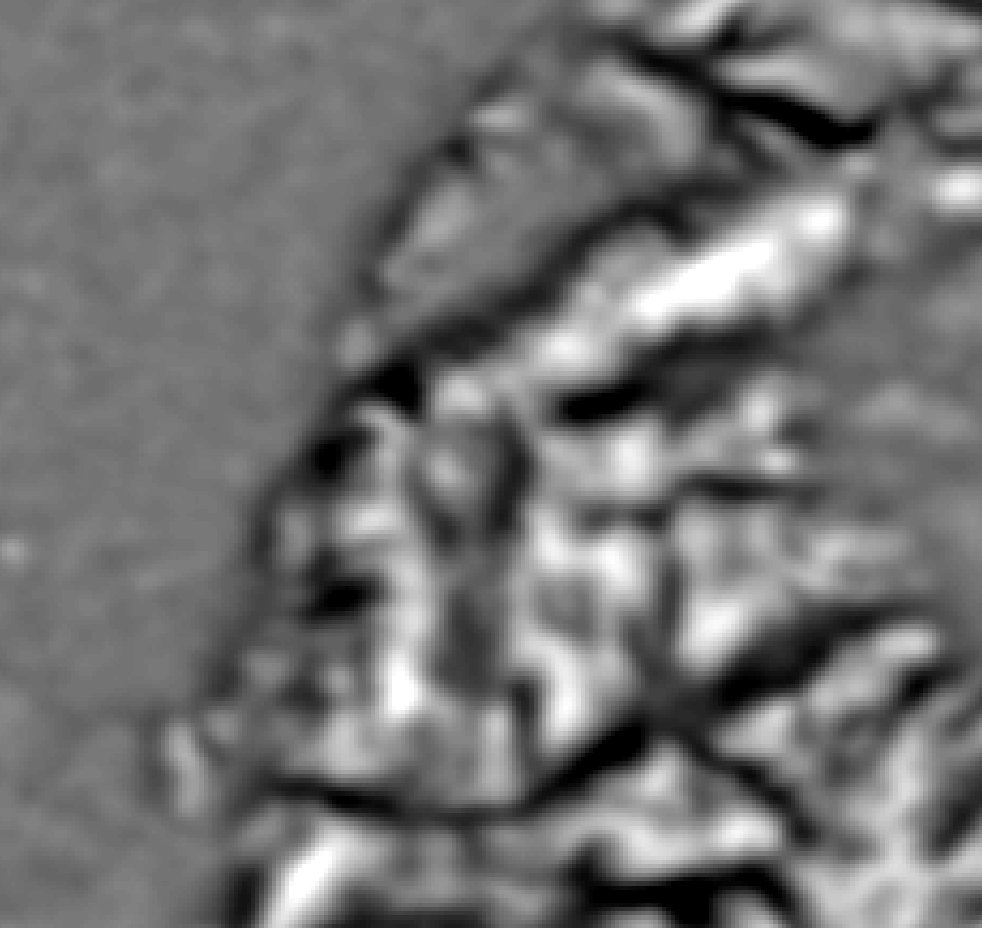
That's the first half done, now to find which ones of those have a suitable elevation. There are a few ways to do this but I use the conditional function, the syntax gets a bit messy here but you can also split it up (like i normally do) 7/ 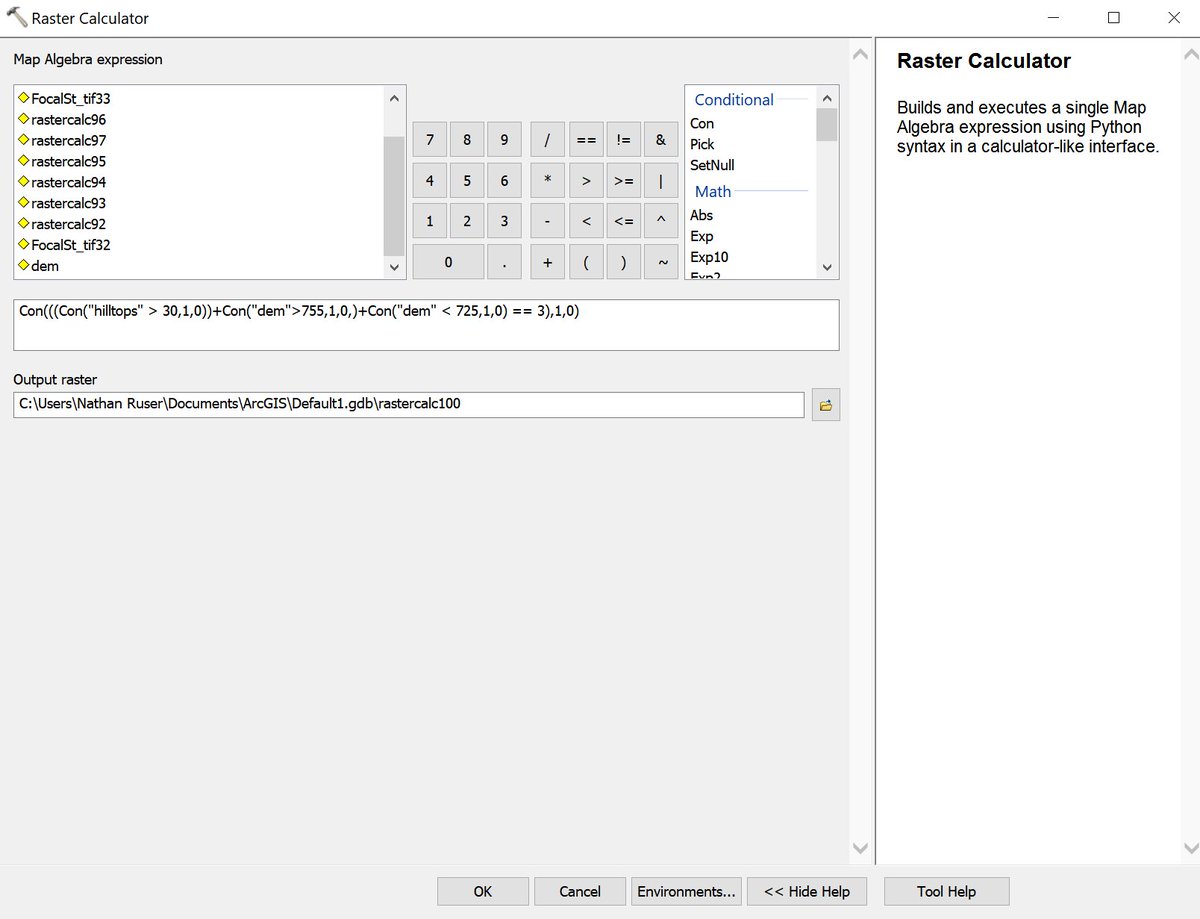
The easier way to do it (I did that before hence the mess of 'rastercalc' files, is to do one conditional function to separate the hilltops, another to find areas higher than 725m, another less than 755. Then add them all together and values of '3' are what you look for 8/ 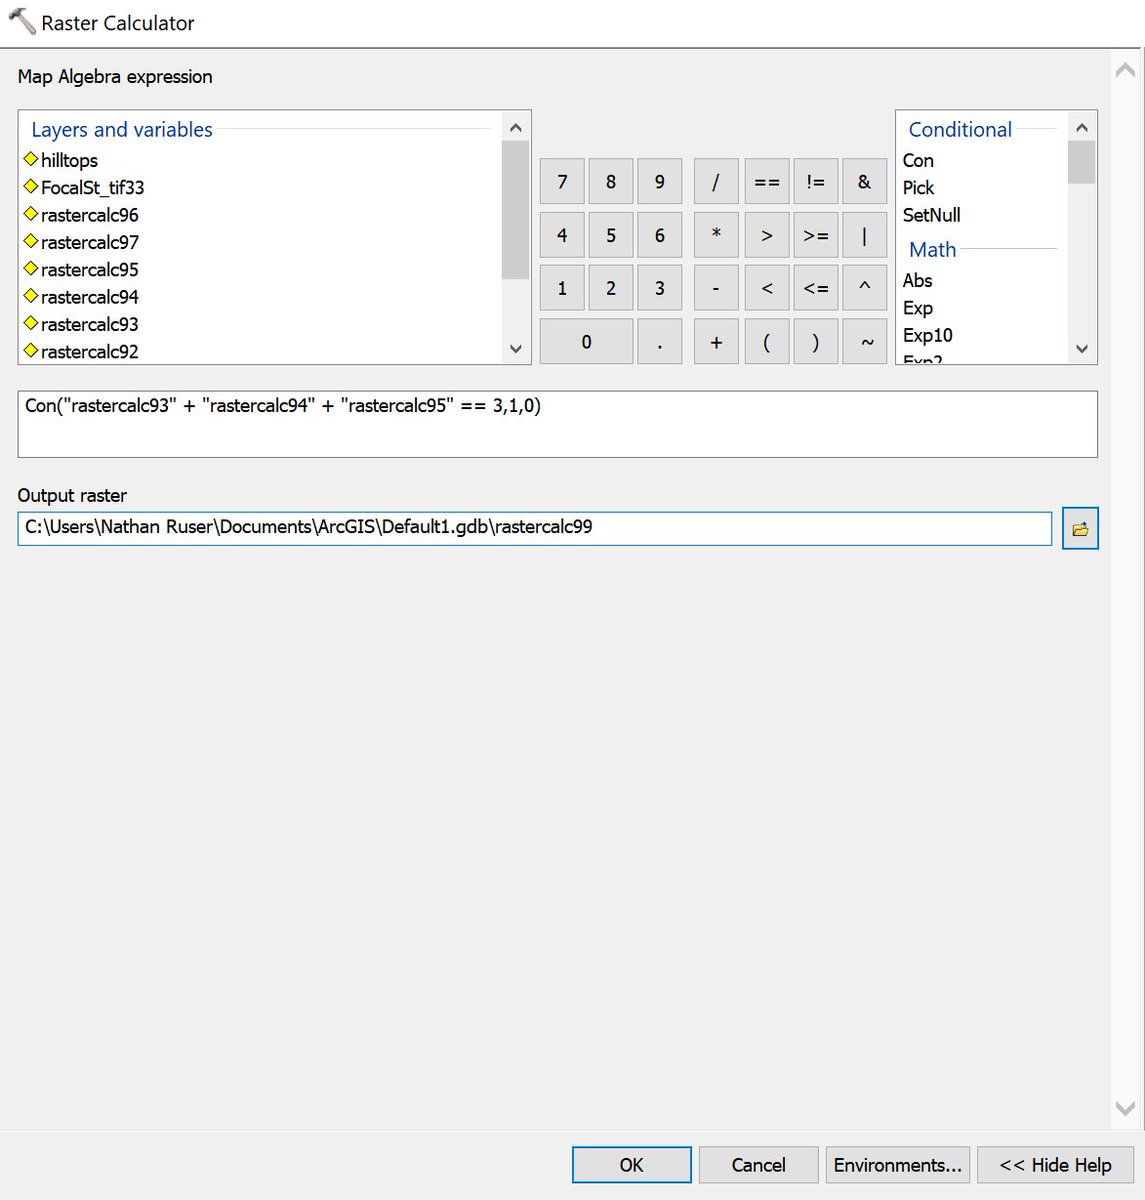
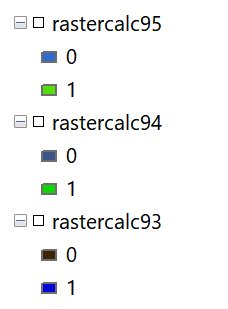
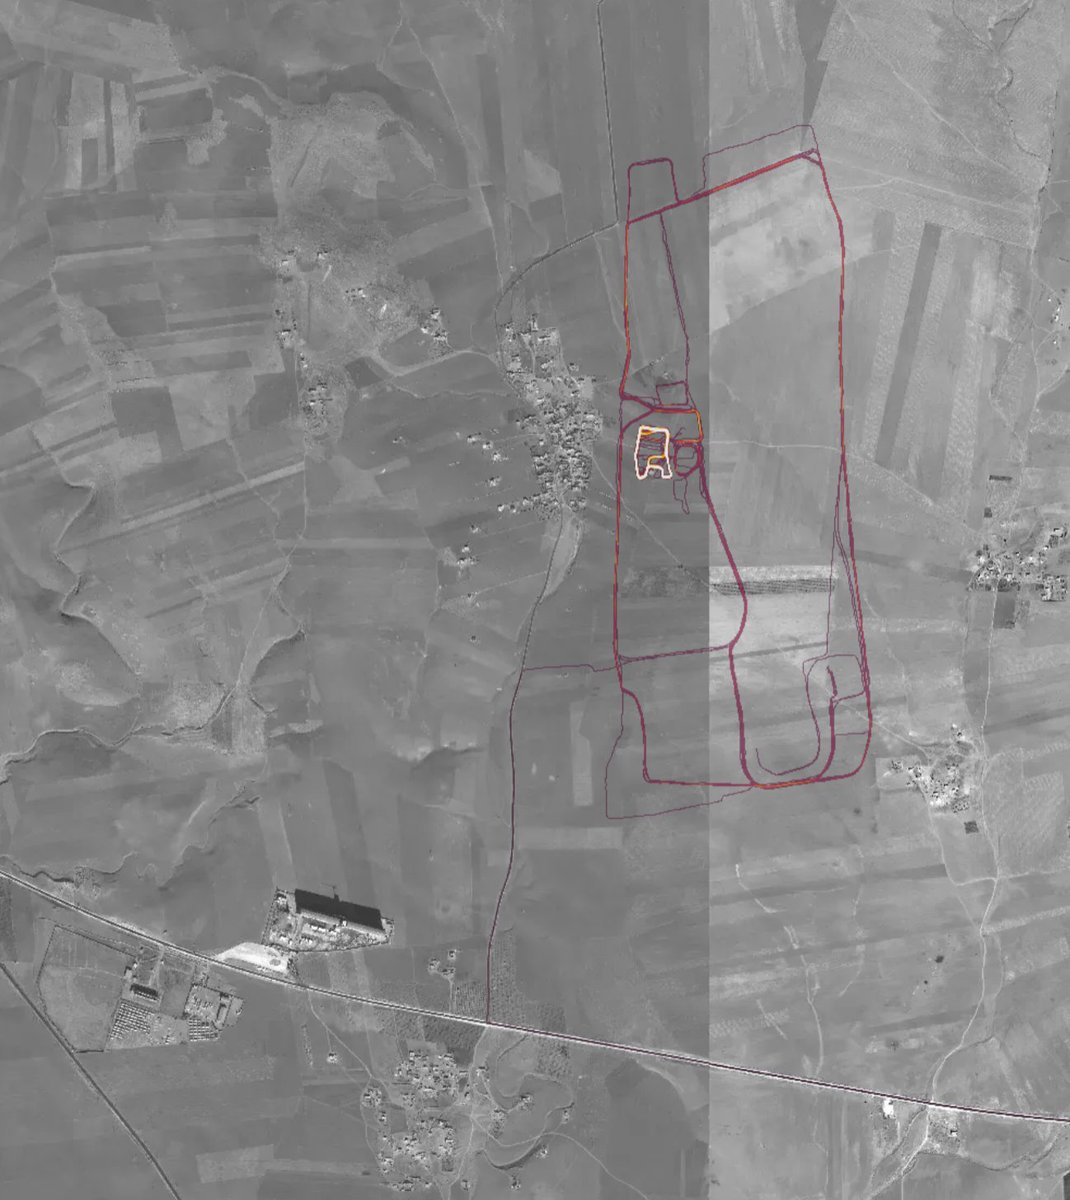
So to help visualise this, in this map the blue areas represent an elevation of between 725 and 755m, and the green areas are the hilltops. You can clearly see the intersect. 9/ 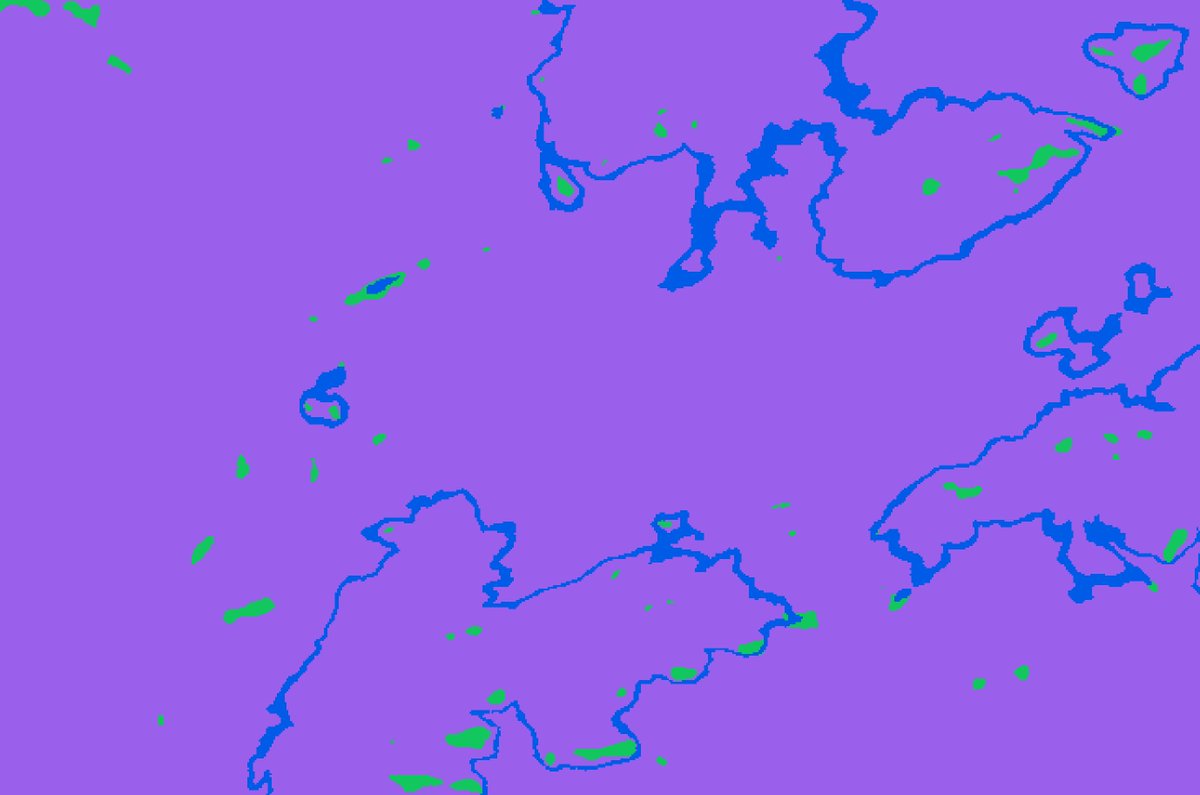
From here it's pretty simple to narrow down where you should look to geolocate. There are 3 possible hills that could be named 'point 740', but the most prominent and the clearest is the one to the NW of Rajo, This also fits with the avenues of approach we know were used 10/ 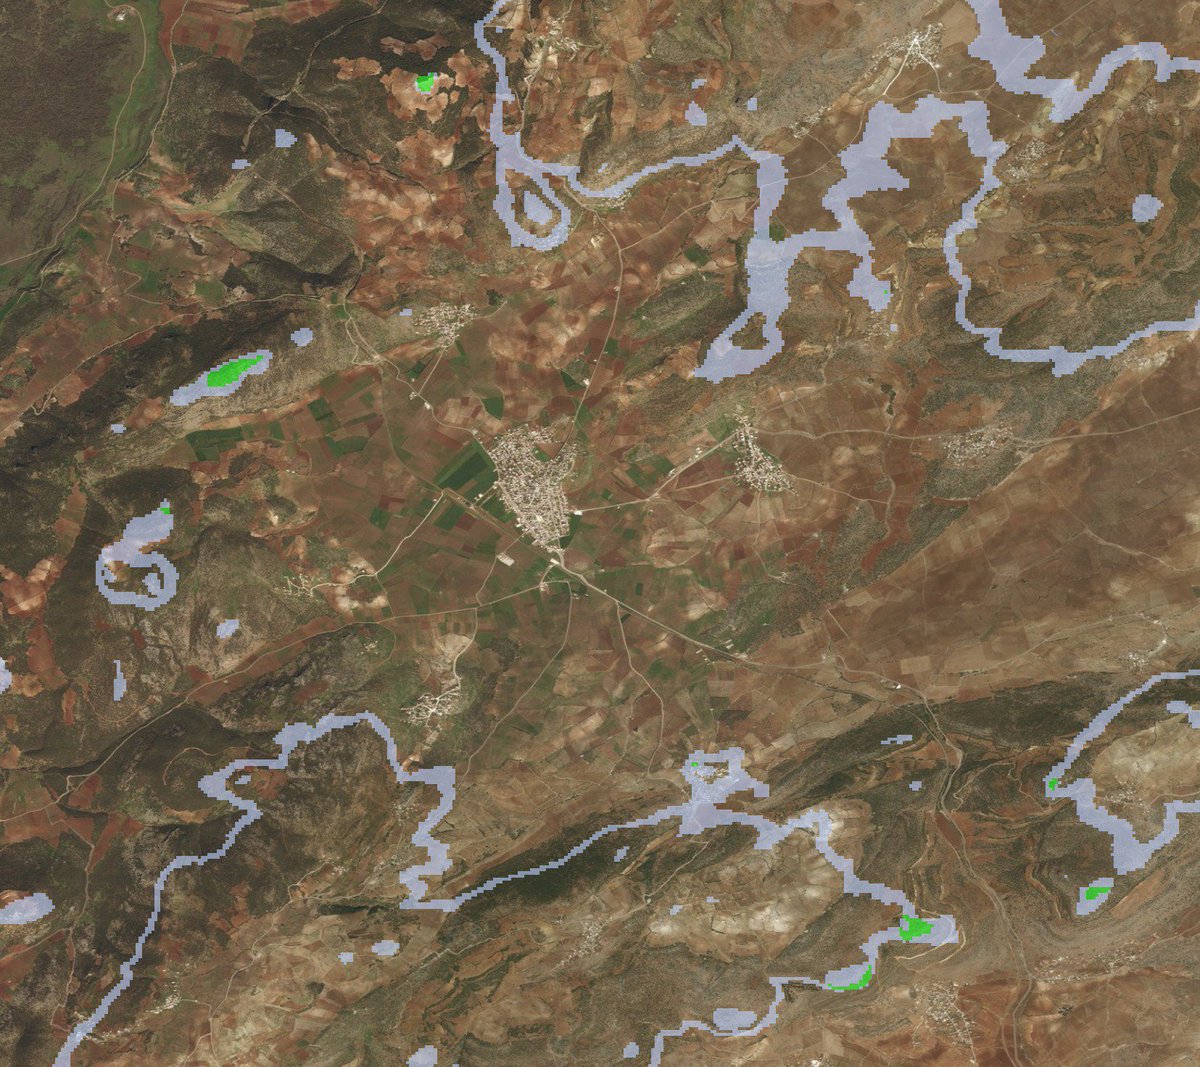
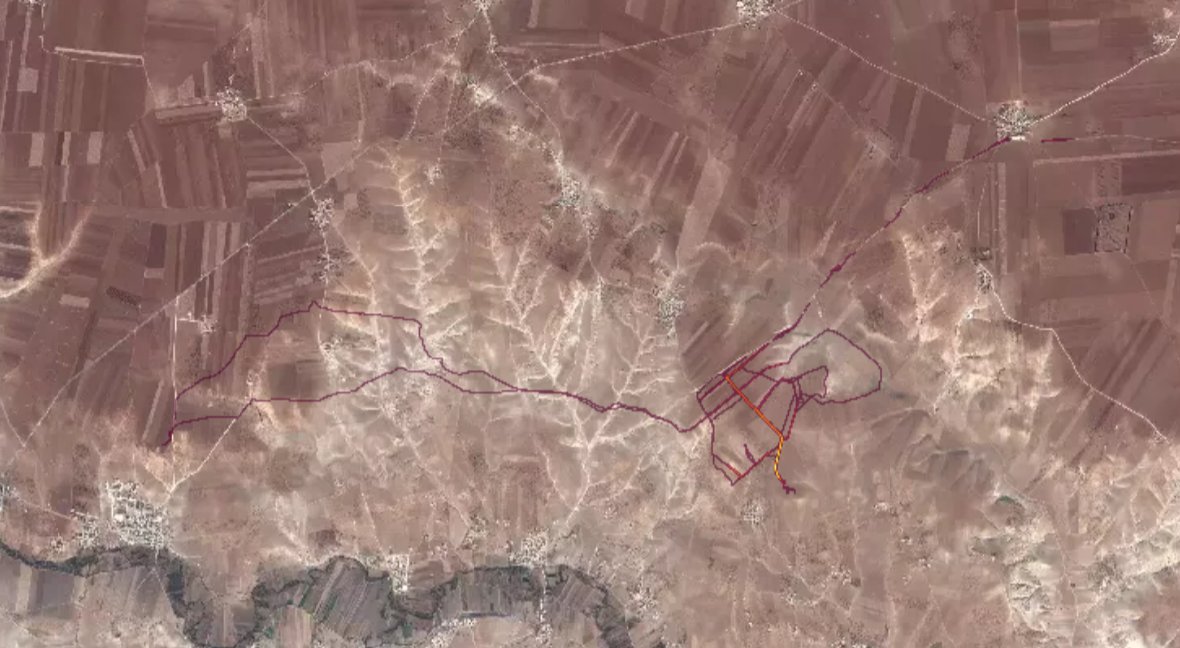
As it so happens, this position has already been geolocated,
and it was bang-on where you'd expect based on the GIS analysis. This can save a lot of time messing around and looking at all the hills separately. 11/
and it was bang-on where you'd expect based on the GIS analysis. This can save a lot of time messing around and looking at all the hills separately. 11/
If you're not sure how to do all the technical details here, it can also be approximated in Google Earth. Using 3D Polygons to find the elevation range and then eye-balling to find the hilltops. Again you get a similar result 12/ 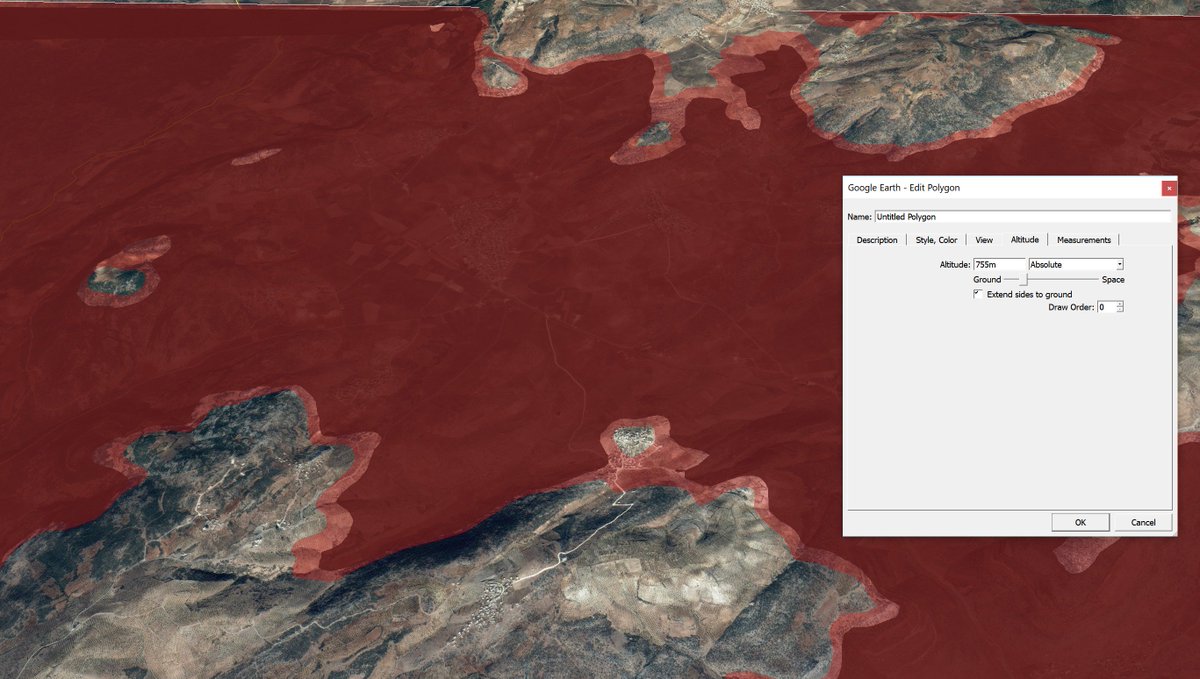
Here's another example, slightly more complex (sorry fam). This footage of a possible war-crime in Afghanistan doesnt give you much to work with . A paved road, ploughed snow and a red building. 13/
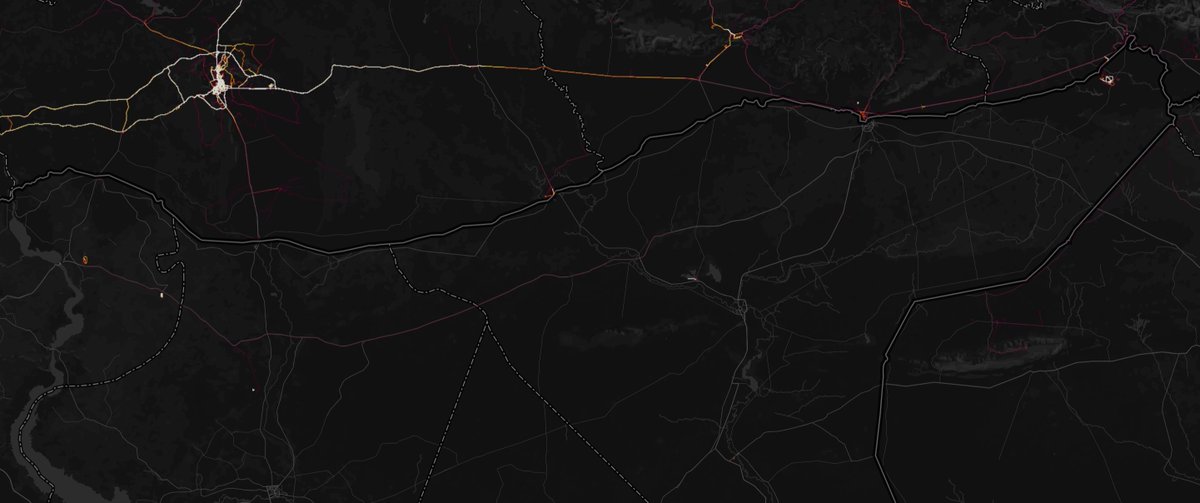
But a lot of that data is available. Context tells us the video was most-likely filmed in March 2017, and it is possible, using MODIS data modis-snow-ice.gsfc.nasa.gov/?c=MOD10A2 to download there in the world was snowy that month. In this map areas in red were snowy that month 14/ 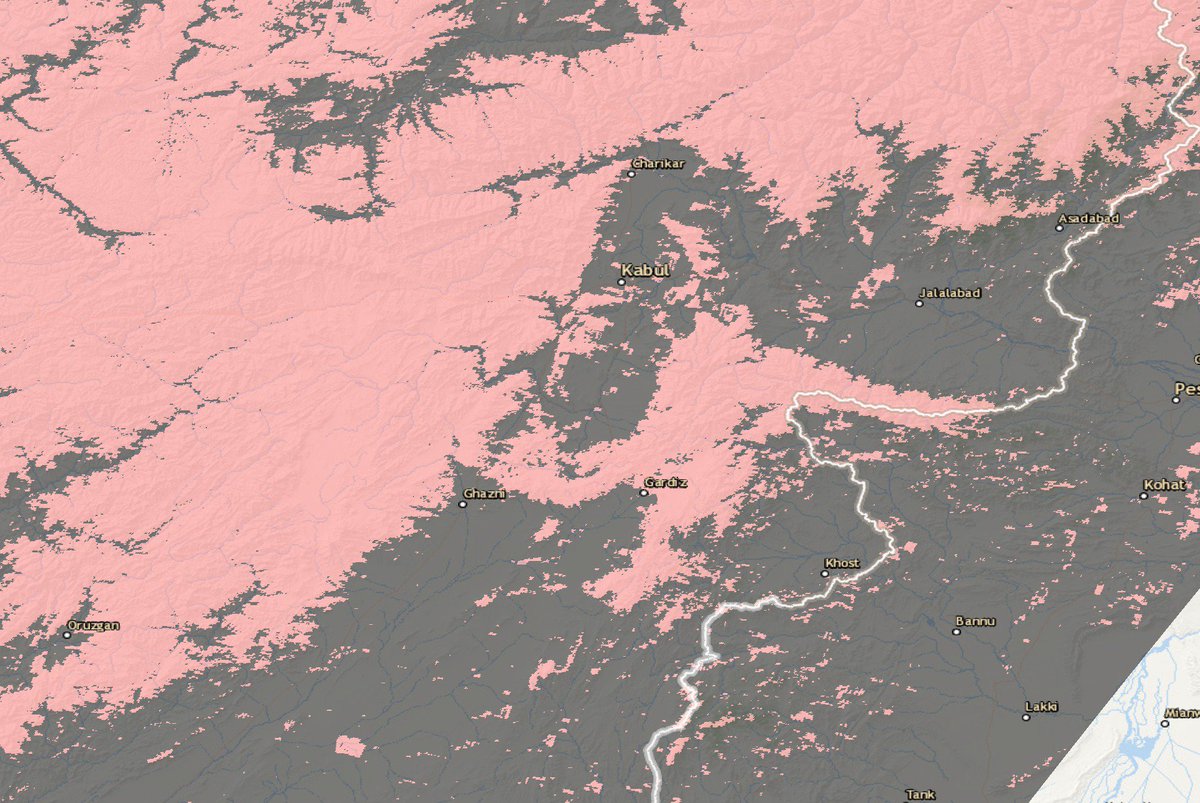
The road data is also available, from either HDX (data.humdata.org/dataset/afghan…) or OSM, divided into primary, secondary and minor roads. Based on it being a paved and plowed road, you can pretty easily narrow it down to a primary road. 15/ 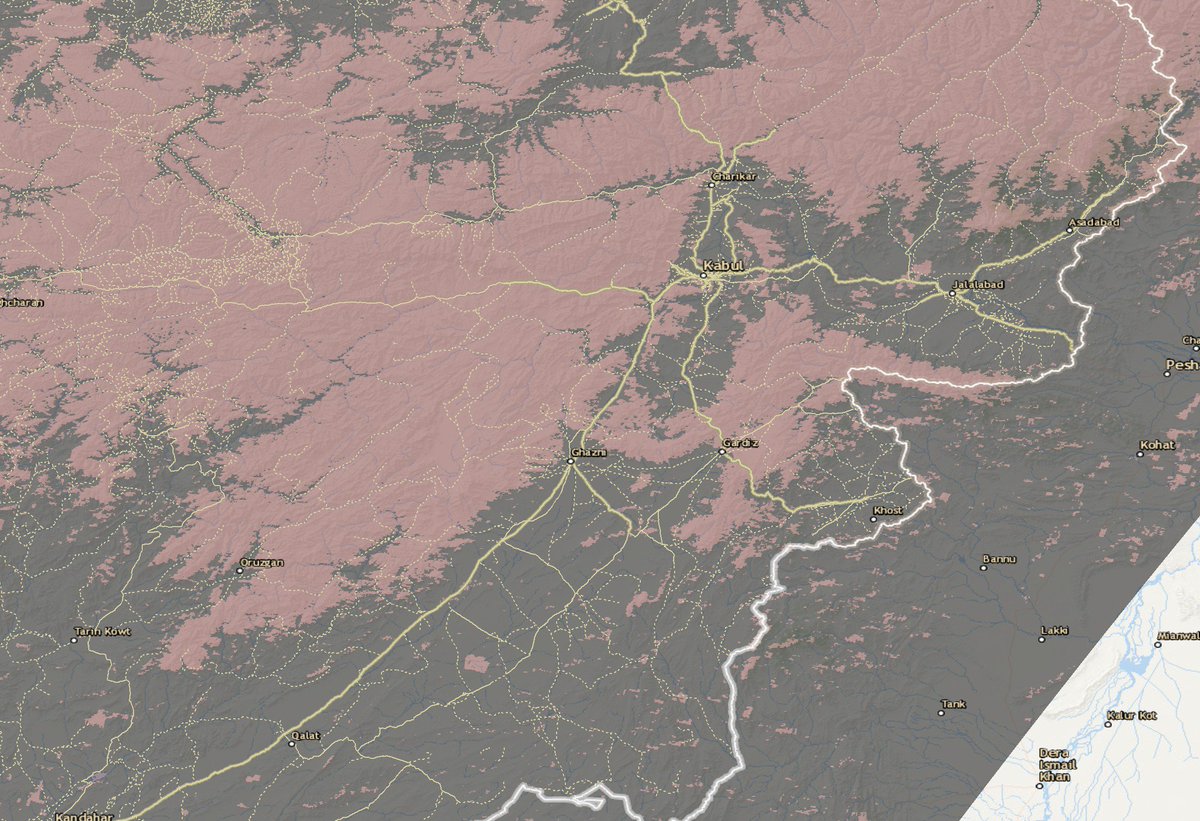
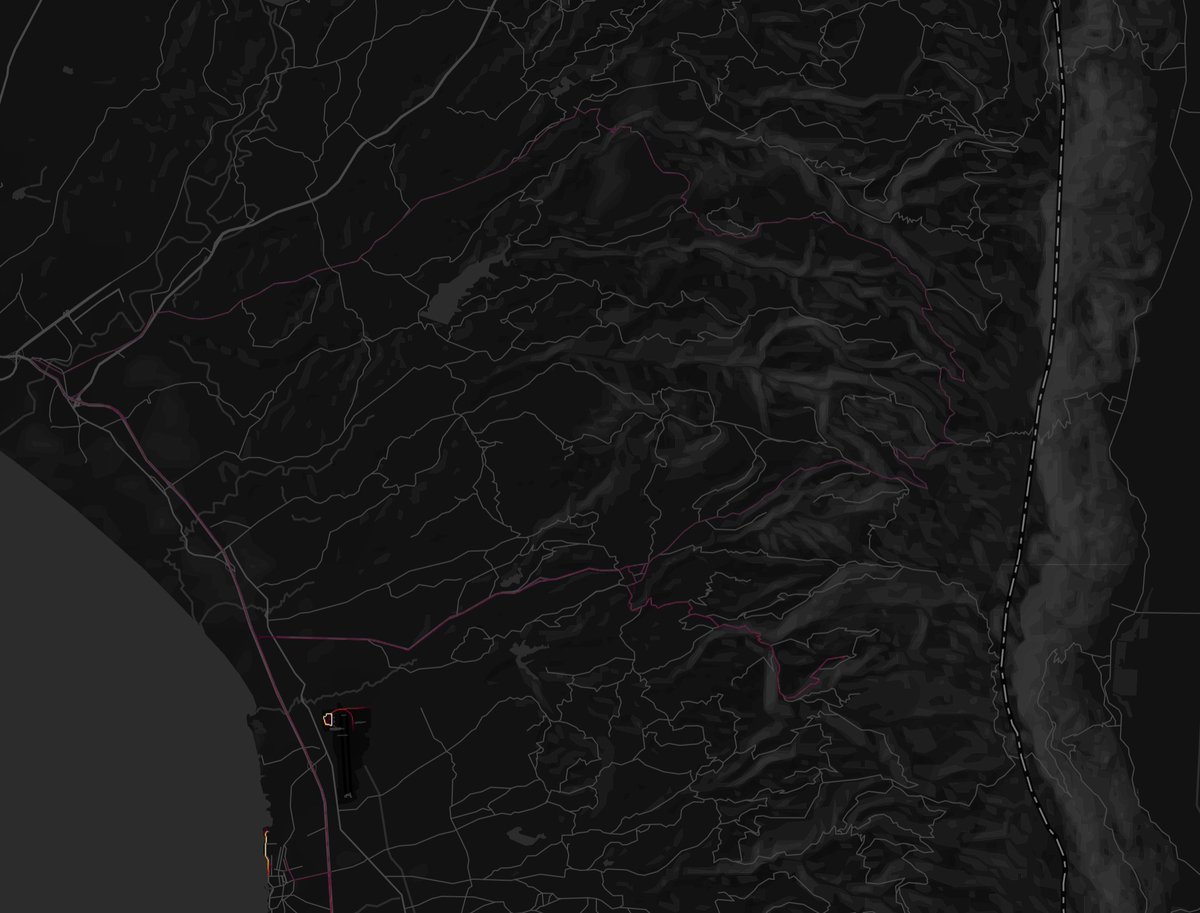
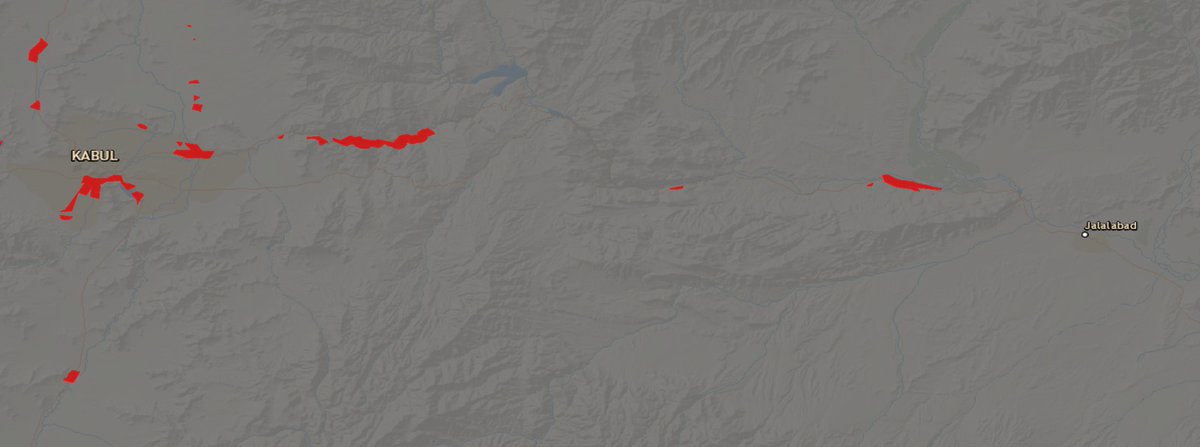
The video, in general, suggested they were combat ops against ISIS-KP, which is mainly active around Nangarhar. But that can't be at all relied on. In red here are the areas with snow-cover that month, and intersected by a primary road. 16/ 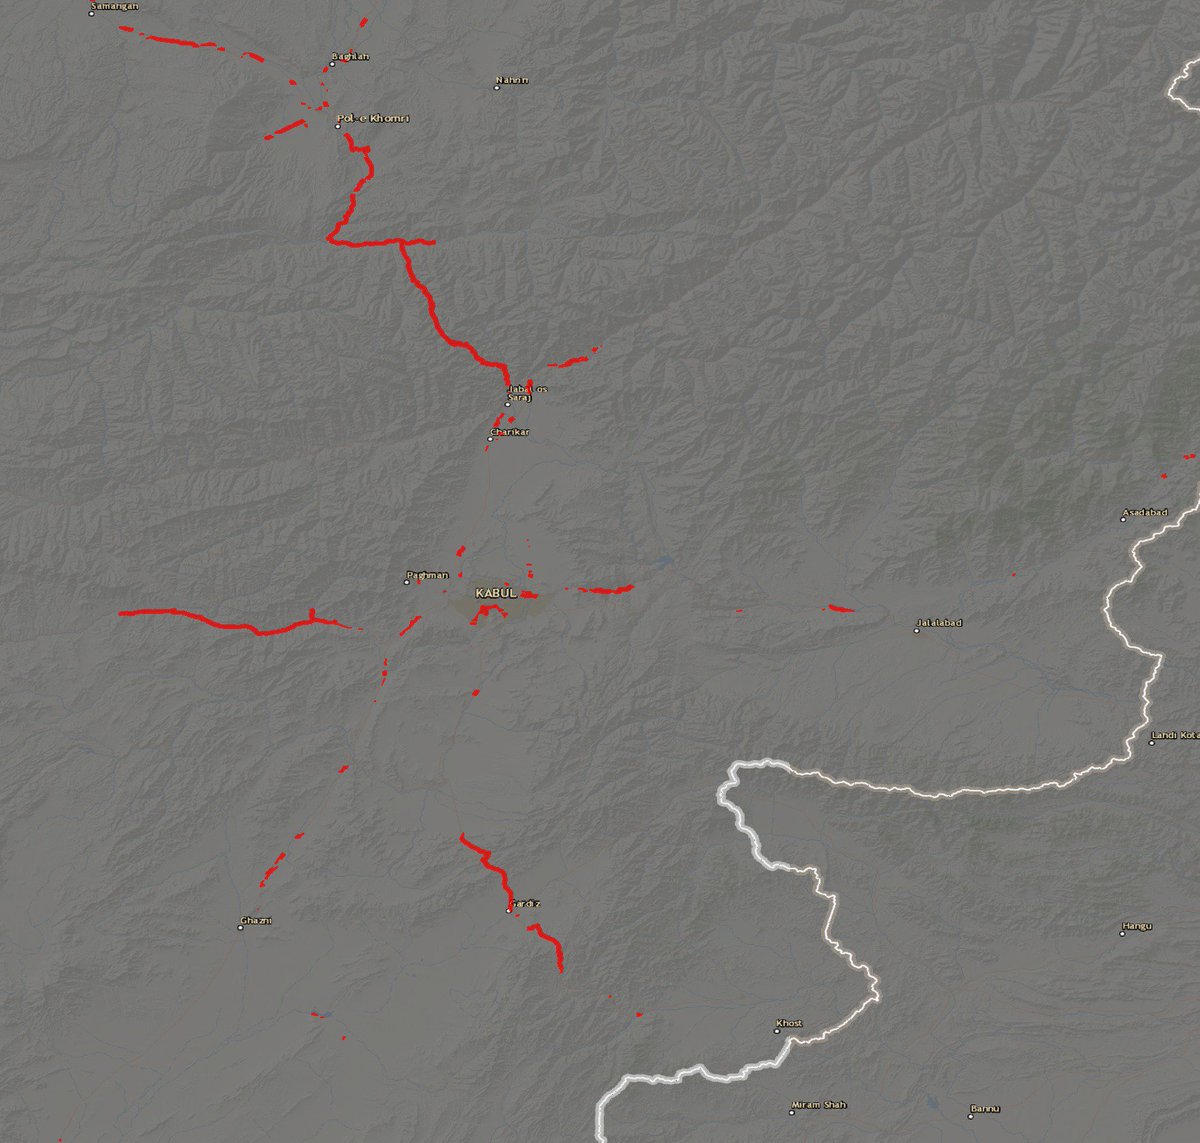
I'm overseas right now without good wifi, so I haven't had time to look through all the roads. But based off this data I know where'd I'd be starting to look, either the highway between Khost and Kabul, or Jalalabad and Kabul, in those snowy areas. 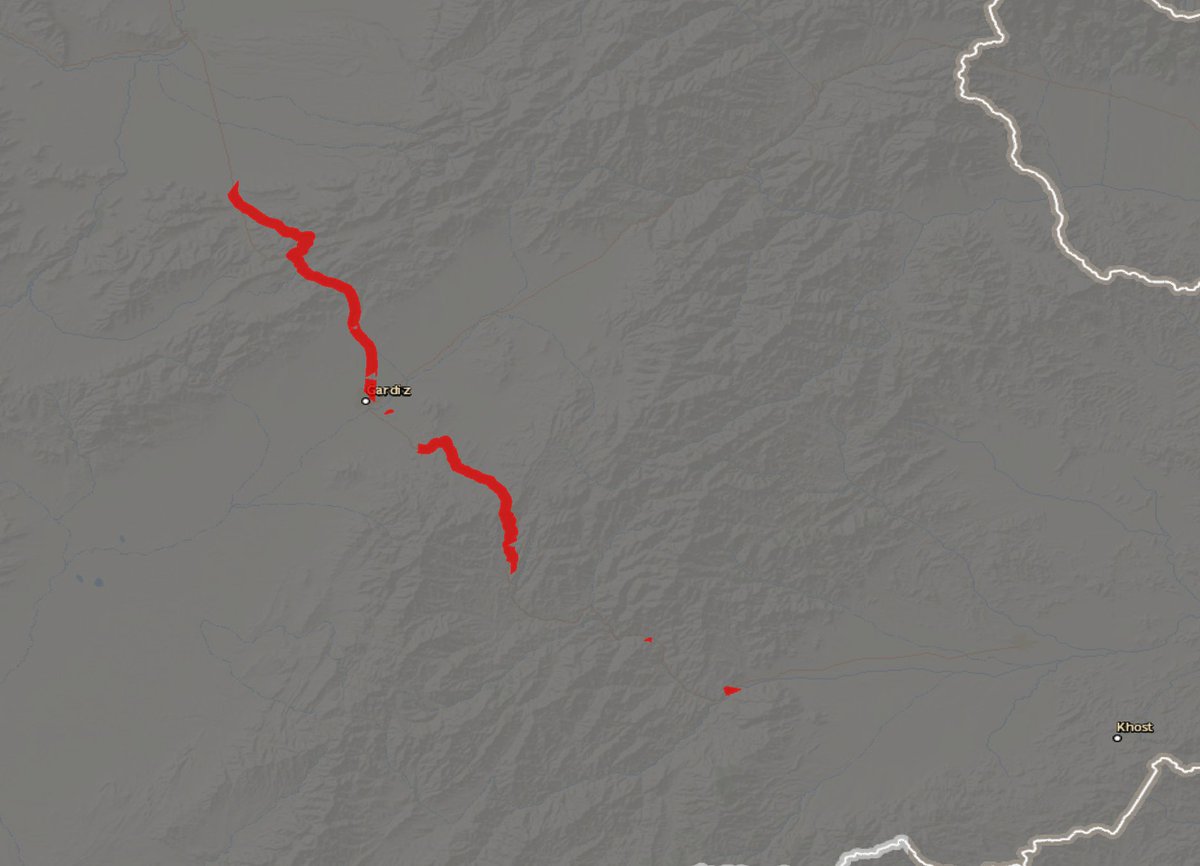
This level of complexity, however, would be impossible to do in Google Earth, however open source programs such as QGIS (very capable but with a steep learning curve) would have no problem. If anyone has questions or wants help on detailed methodology hmu but good luck!
END
END
OH one last thing! GIS is an amazing and almost completely open-ended tool for analysis. Dont look to follow strict tutorials or methodologies but think about how it would be possible to narrow down the data to what you want, and then work out how to do it after.!