=============================
What are they?
Why do we need 3 of the damn things?
Which should I use?
Are they the same, or different, or a bit samey?
An #ORBITA-HQ #tweetorial.
#Meded #FOAMed
Suppose you are walking through an unfamiliar forest and the road comes to a fork: you have to choose one path.
As you stand, uncertain, a troll pops out of the ground.

As always, the advice he offers is scrupulously correct, but not necessarily instantly interpretable to the layperson.
"I have just finished randomly advising 2000 indviduals to go left or to go right. Of the 1000 who went left, 10 were killed and eaten by wolves. Of the 1000 who went right, only 5 suffered that fate."
[For the same number of people going down each path] how many TIMES more deaths in the path being described, than in the other (control) path.
So that's it. We can go home now.
Bye bye!

This is the ACTUAL weekend tweetorial. No actual weekend tweetorial has ever been so easy and painless.
Nobody is crying yet so there must be more.
He reveals that the primary endpoint of "wolf-mediated-eatage AT 60 MINUTES" was only recently implemented.
An independent advisory panel set this when the earlier primary endpt, long-term wolf-mediated-eatage, was deemed unsatisfactory.

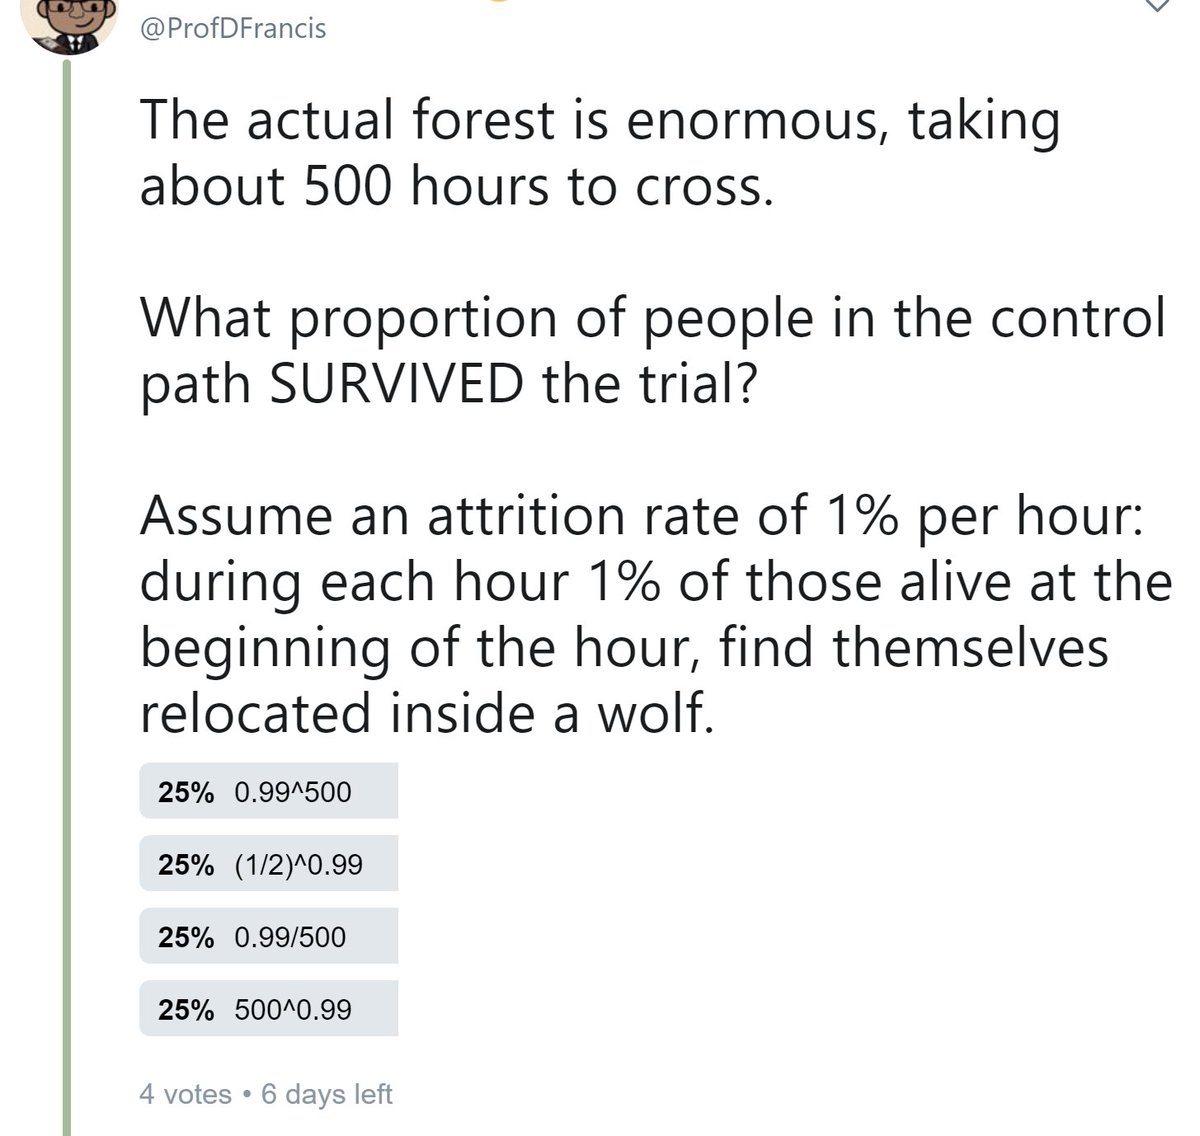
What proportion of people in the control path SURVIVED the trial?
Assume an attrition rate of 1% per hour: during each hour 1% of those alive at the beginning of the hour, find themselves relocated inside a wolf.
Hint:
Remember, the 5/1000 mortality each hour means the probability of surviving ONE hour, assuming one was alive at the start of it, is 995/1000.
Got to do that all 500 times.
The intellectual vanguard of the Tweetorial-do'ers don't seem to be in evidence today.
|
| Side note for clarification
|
|
Maybe people don't all know this
Maybe not have recognised "^" as denoting "raised to the power of"
If you got the above two right, you can skip this side note.
The chance of succeeding is
(1/2)x(1/2)x(1/2)x.....x(1/2) i.e. 10 lots of "(1/2)" being multiplied together.

So I've done what we do in many computer languages, Excel etc: the "^" symbol means "raised to the power".
(1/2)^10.
I've written brackets around the 1/2, to stop anyone from thinking I mean 1 divided by: 2^10
The one catch is that most often people give you the probability of DYING. Remember that the "^N" formula only works for SURVIVAL probabilities.
END OF SIDE BAR
---------------
At 15 votes, the majority are right on the last two questions.
For 500 hours, the probabilities of SURVIVING are as follows:
0.7% in the control arm
8.2% in the active arm.
Hmmm...
"Troll-mediated decision-making MORE THAN 10 TIMES SAFER than the traditional visually guided approach."
"Ignore your eyes.
Troll Never Lies."
Class I, Level of evidence D
Transatlantic Society of Monsterology
It was only half as dangerous earlier.
How can it have become much, much better than the other arm?
Let's all think about this and catch up to this point, and then I will go further.
[Night night, sleep tight, don't let the wolves bite.]
Control and Active arms, respectively:
The relative risk of the active arm is 0.924, in comparison to the control arm.
Is this 10 times safer?
(A) Lack of symmetry
At 500 hours, there is [~12 more probability] of SURVIVAL, but only a [very slightly lower] probability of DEATH
When risk becomes high, it can't get much higher
One way to say this is, "once you are dead, you can't get killed again".
Professor GW Bush put it more elegantly:
=========
Using ODDS and ODDS RATIOS, instead of risk and relative risk, fixes the first problem.
(It also allows us to deal with case-control studies, but that is for another day. Probably the 32nd of Nevember 2999 as I don't like case-control studies).
e.g. imagine a die being thrown:
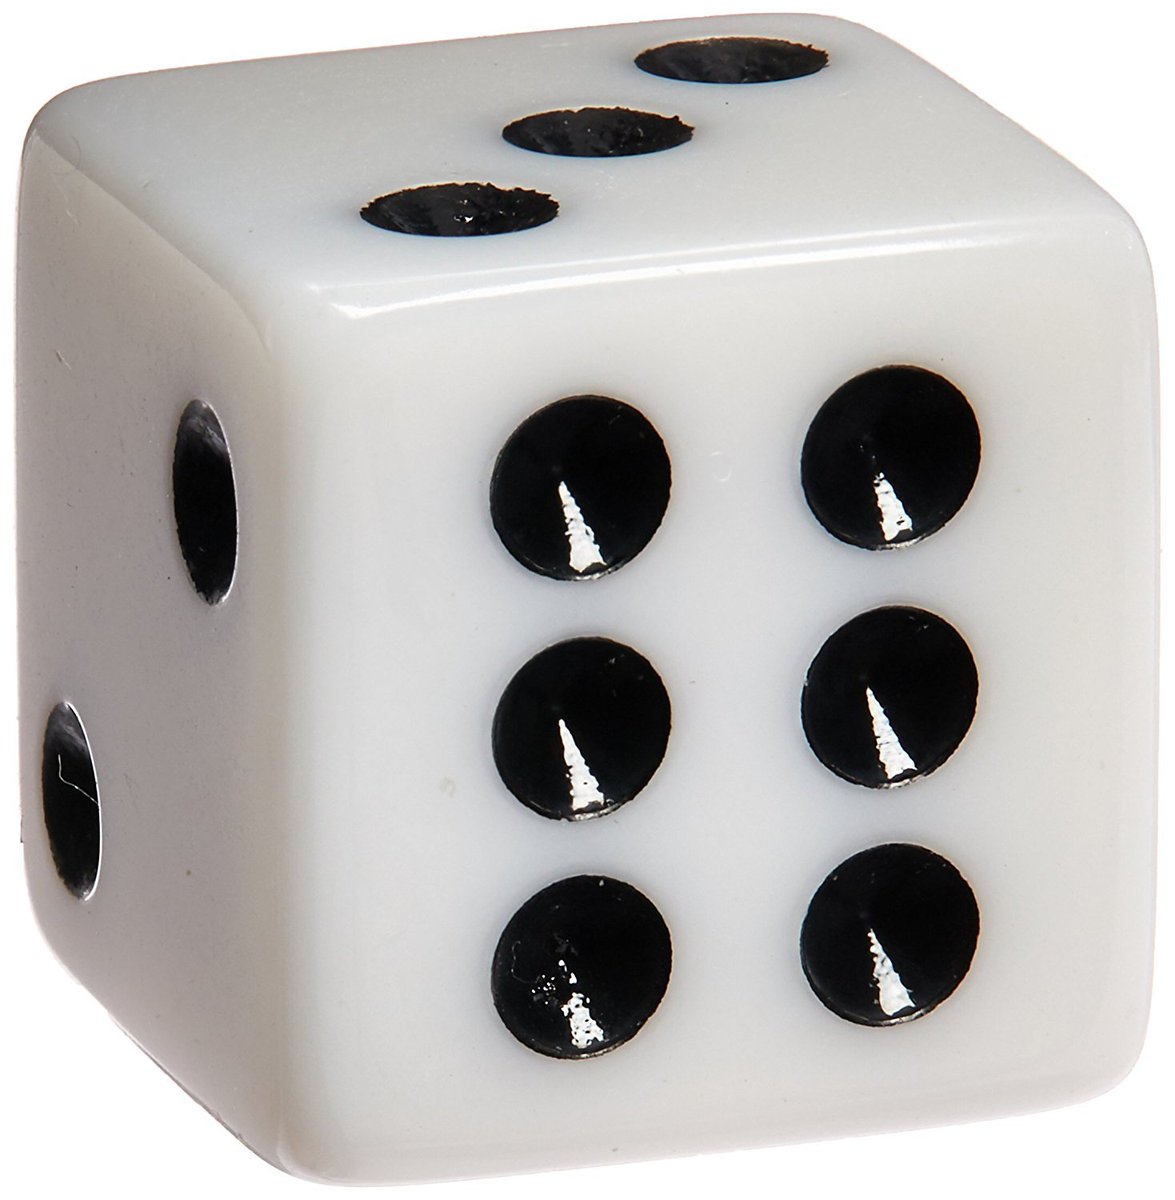
This is defined as:
The number of ways of WINNING
-------------------------------------
The number of ways of throwing
Hint: this is an easy Question, in case you are thinking your answer is too obvious
ODDS =
Number of ways of WINNING
---------------------------------
Number of ways of LOSING
What is this?
Odds = ways of winning / ways of losing
... but you can also write it as:
Odds = Prob of winning / Prob of losing.
To see this in action, what is the PROB of winning, divided by PROB of losing?
Does the result come out to be the same as the odds you _directly_ calculated as "Ways of winning ÷ Ways of losing"?
At the 500 hour timepoint:
Control arm, mortality = 1-0.99^500 = 0.993.
Active arm, mortality = 1-0.995^500 = 0.918
At ONE hour, relative risk was 0.50.
What is the RELATIVE RISK of the active arm at 500 h?
Does this 500-hour relative risk resemble the one-hour relative risk of 0.50?
Let's try it by ODDS ratio.
In the control arm first
-------------------------
Probability of survival at 500 hours is .99^500 = 0.007.
What is the ODDS of survival at 500 hours?
Odds is
PROBABILITY OF IT HAPPENING
---------------------------------------
PROBABILITY OF IT *NOT* HAPPENING
Probability of survival at 500 hours is 0.995^500 = 0.082.
What is the ODDS of survival at 500 hours?
Odds of 500-hour survival
in the CONTROL arm: 0.007
(because 0.007 divided by almost 1 is still ~0.007)
in the ACTIVE arm: 0.089
So what is the ODDS RATIO for SURVIVAL at 500 hours, ACTIVE arm versus control?
In control arm:
Prob of death = 1-0.99^500 = 0.993
ODDS of DEATH =
Hmm... not good.
And in the ACTIVE arm?
Prob of death = 1-0.995^500 = 0.918
ODDS of death =
Active arm: 11
Control arm: 151
What is the ODDS RATIO of death in the active versus control arms?
Is that strange?
Earlier, we calculated that
ODDS RATIO for SURVIVAL is about 13
Now we are finding that
ODDS RATIO for DEATH is about 1/13
Do you remember the definition of ODDS?
Odds of dying = P(dying) / P(living)
Odds of living = P(living) / P(dying)
Prob (Ajay is NOT annoyed) = 1 - Prob (Ajay IS annoyed)
But
Odds (Ajay is NOT annoyed) = Odds (Ajay IS annoyed) *UPSIDE DOWN*
"Probabilities are best for adding-and-subtracting
Odds are best for multiplying-and-dividing*"
A Einstein
J Not Quite True But Useful Rules Thumb, 2018
But ODDS of death are 151.2, and rise to 152.7 after just an hour.
Many statistical models treat probability by turning it into log of odds.
Including some v complex ones by F Harrell which ORBITA HQ are currently wrestling with.

Ability to carry on getting worse even as probability plateaus at ~1.
Ability to say the "effect on death" is exactly the reciprocal of the "effect on survival"
*but* there is one not quite so good thing.
0.5% death in the active arm, 1% death in the control arm.
What was the relative risk of death in the active arm?
0.005/0.995 in the active arm
0.01 / 0.99 in the control arm
What was the ODDS RATIO of death in the active arm versus the control arm?
Whenever that happens, relative risk and odds ratio are almost the same.
But at 500 hours, in the active arm relative to the control arm:
RELATIVE RISK for death is 0.924
ODDS RATIO for death is ~1/13
On the back cover, it has - in large and threatening letters - the phrase "DO panic".
We are not going to claim 10-fold or 13-fold better, because people won't always be doing 500 hours.
We want something in-betweeny.
Not RR, which collapses back to 1 in the long term (since everyone dies eventually)
Nor Odds ratio, which continues to expand in size with time.
Next week I will cover that method: the amazing instantaneous HAZARD RATIO.
Questions welcome.
See you next week for continuation.
Take care, in the "Francis Forest Reserve". 😯
