I'm doing a review of my upcoming report on understanding updates to the EPA Inventory of greenhouse gas emissions from natural gas systems, so I figure I will include some factoids in this thread along the way.
In 2016, US greenhouse gas emissions totaled 6,511 million metric tons of carbon dioxide equivalent, down 1.9% from 2015 and 11% below 2005 levels.
A programming note from here on out. I'm labeling "million metric tons of carbon dioxide equivalent" as MMTe for brevity.
Note on the CO2-equivalences: The EPA global warming potentials (GWP) are consistent with the IPCC Fourth Assessment Report. The GWP for methane is 25.
Higher GWPs for methane and other gases found in the IPCC Fifth Assessment Report are not yet incorporated into the Inventory.
Higher GWPs for methane and other gases found in the IPCC Fifth Assessment Report are not yet incorporated into the Inventory.
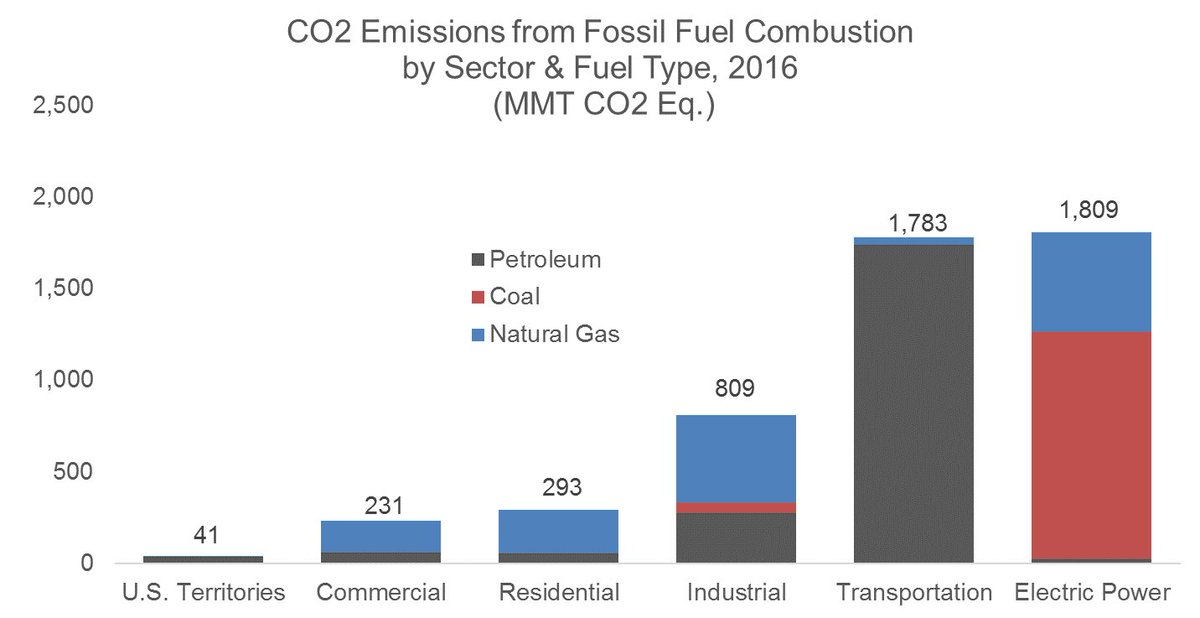
Total CO2 emissions from fossil fuel combustion equaled 4,966 MMTe in 2016, which is 14 percent below 2005 levels.
Petroleum used for transportation and coal used for electricity generation are the two single-largest sources of CO2 emissions from fossil fuel combustion by sector and fuel type. 
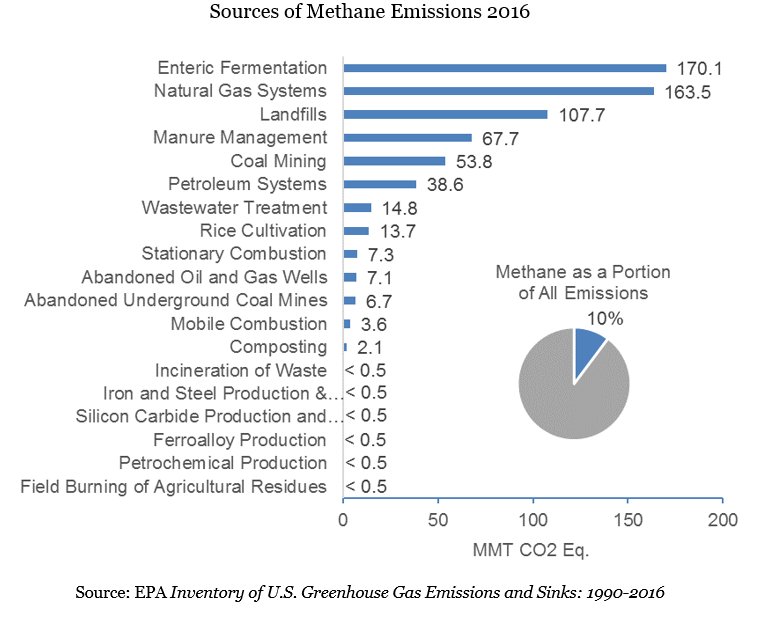
Methane is the second largest contributor to greenhouse gas emissions after CO2. Livestock management, rice cultivation, landfills, oil and gas production, and coal mining all contribute.
Enteric fermentation (cow burps and farts) is the number one source of methane in the US.
Enteric fermentation (cow burps and farts) is the number one source of methane in the US.
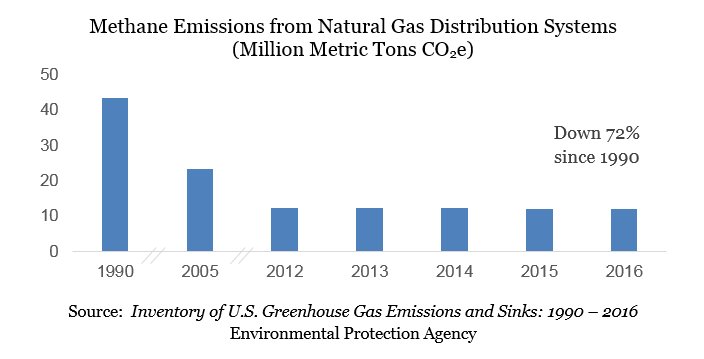
Annual methane emissions from natural gas distribution systems declined 72 percent from 1990 to 2016.
Industry-wide, natural gas emissions as a rate of production (the “leakage rate”) is 1.2 percent—a level well below even the most stringent thresholds for immediate climate benefits achieved through coal to natural gas switching.
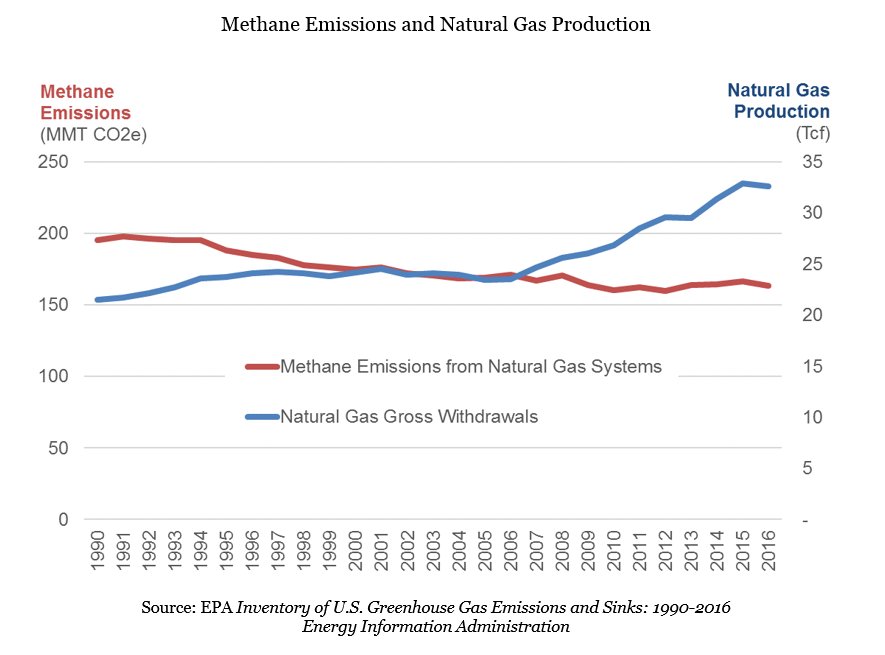
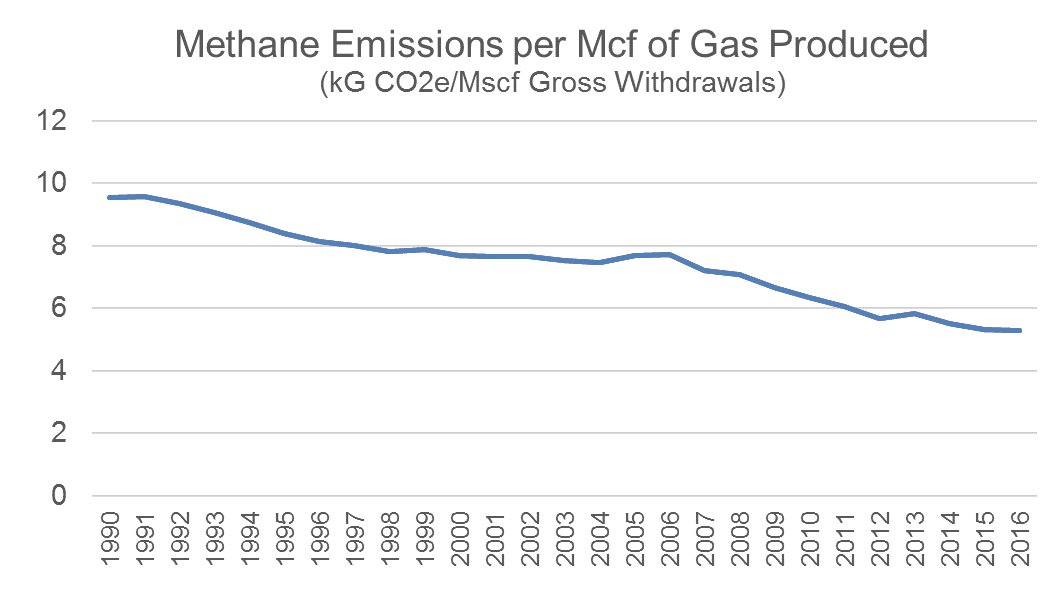
Since 1990, absolute methane emissions in the US have declined 16 percent, even as gross natural gas withdrawals (production) climbed 53 percent.
Methane emissions from natural gas distribution systems was 12 MMTe in 2016, a decline of 72% from 1990 levels.
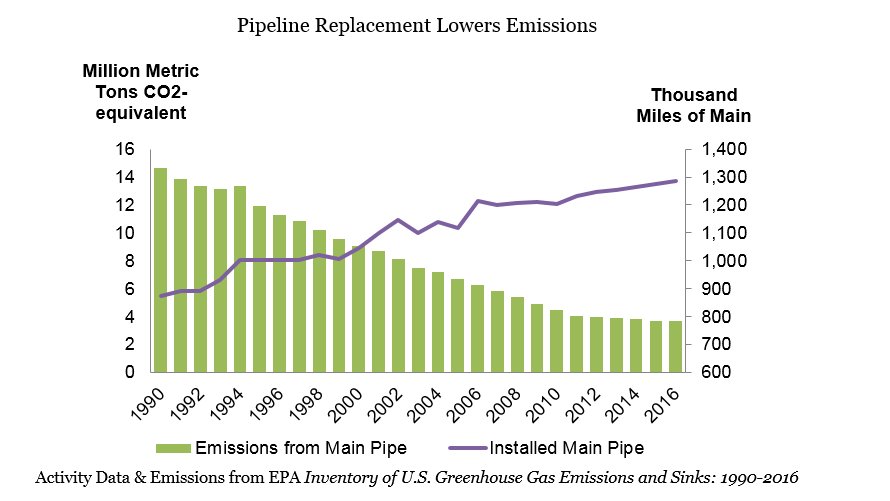
This drop occurred as gas utilities added 739,000 miles of distribution pipeline to serve 19 million more customers with gas service.
This drop occurred as gas utilities added 739,000 miles of distribution pipeline to serve 19 million more customers with gas service.
The natural gas distribution system has expanded to serve more customers while its methane footprint has declined because pipeline replacement lowers emissions. Utilities continue to systematically upgrade infrastructure through risk-based integrity management programs.
During the past two decades, annual methane released from natural gas systems declined as production grew. Taking the ratio of these values, methane emissions per million cubic feet of natural gas produced (gross withdrawals) declined 44% between 1990 and 2016.
I may add some additional data later, but first some meta-commentary:
EPA's Inventory is a continual work in progress. Trends in natural gas system emissions are markers that signify directionally how new information better informs our understanding of GHGs from natural gas.
EPA's Inventory is a continual work in progress. Trends in natural gas system emissions are markers that signify directionally how new information better informs our understanding of GHGs from natural gas.
New information will continue to refine the emissions estimates in the Inventory. Better information helps focus attention on cost-effective opportunities for emissions reductions identified in the data.
All told, because of improvements in technology, better practices, ongoing science, and our collective understanding of the existing trends reported to and by EPA, signs point to a continually improving emissions profile of the natural gas industry.