Lots of headlines @escardio re CT-FFR. 1 of most prominent is ADVANCE multicenter registry from @manesh_patelMD & colleagues using @HeartFlow. I'd like to dissect this a bit to see how excitement in a field combined with lots of industry funding can blind us to basic problems.
Team worked across 38 international sites over >2 years to collect data from N=5083 patients w/ “symptoms concerning for CAD”. They had primary endpoint of change in management plan from coronary CTA. That happened in 67% of patients. Most impressive.
Is this a valid endpoint? I contend that this is a measurement of physician psychology rather than of anything objective.
Let’s do a thought experiment, if team consisted of docs skeptical about CT-FFR, they would change their management almost never. Conversely, true believers could be easily swayed by even small differences in CT-FFR.
But who is right?
But who is right?
This trial gives *zero* information about what the right treatment for this population or for these individuals *should be* if we are concerned with reducing MACE or death/MI.
Furthermore, how influential should the CT-FFR be?
Well, the authors tell us what sort of CT-FFR values they saw in their patients: 

So most values of CT-FFR for the LAD were between 0.7 and 0.8. @CCook_MD working with @jerd10, @ProfDFrancis and the #ORBITA crew did a really nice study in @JAMACardio looking at all of the published data on CT-FFR to that point. This is one of their figures.
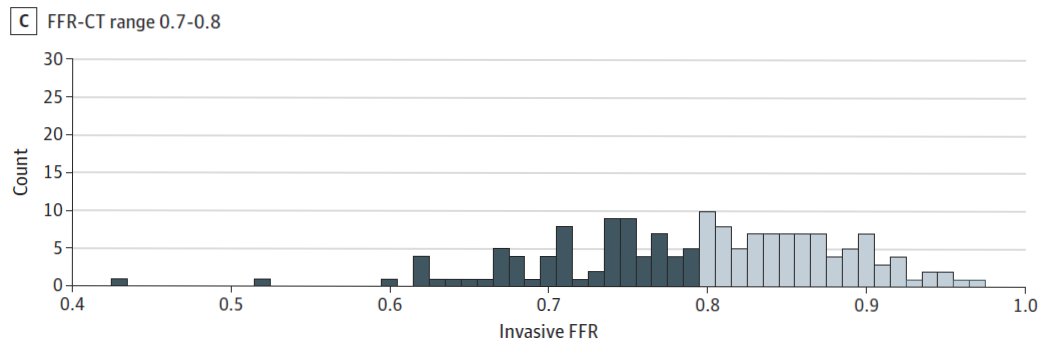
What the figure shows is that about half of the CT-FFR values that fall into this range actually have a discordant invasive FFR measurement (when dichotomizing at 0.8).
So for half of the patients in this study the FFR-CT of the LAD was wrong, relative to what invasive FFR might be. A flip of the coin!
(A little better for LCx and RCA but only a bit.)
(A little better for LCx and RCA but only a bit.)
Should a flip of the coin influence treatment plans?
But even if the CT-FFR was 100% accurate, should that change management? To answer this, lets first look into what these patients were like.
This is Table 1, tweaked a bit to make it easier to see the columns relevant to those who got CT-FFR on a mobile device.
This is Table 1, tweaked a bit to make it easier to see the columns relevant to those who got CT-FFR on a mobile device.

Wow! Only about 1 in 5 patients had typical angina. Even larger share had no angina or dyspnea! Biggest share had atypical or non-cardiac chest pain.
All told the other categories amounted to 77.4% of patients. This sounds bad but is probably not so far off from what type of patients are referred for testing in many centers.
The problem is in a large clinical registry, a patient with atypical chest pain actually has lower likelihood of obstructive disease at angiography per @manesh_patelMD than one who is asymptomatic per his seminal @NEJM paper.
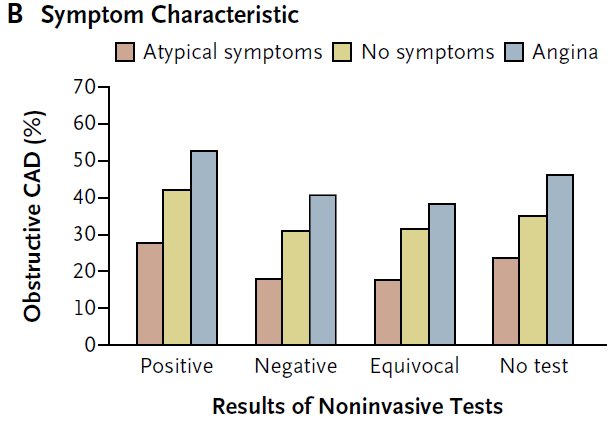
So these low risk patients with stable chest pain and mostly asymptomatic or atypical symptoms shouldn't automatically get a change in management based on CT-FFR or even invasive FFR.
A lot will depend on whether the doctor believes in #COURAGE like @DavidLBrownMD or whether they believe in #FAME2 (whose results almost certainly reflect subtraction anxiety, as does this study).
Of course patient factors likely weigh in quite a bit too. Things like refractory/severe symptoms, frailty, etc should weigh in also, but are unlikely to be outweighed CT-FFR alone.
One interesting thing would have been to take a poll of how strongly the participating docs believe in COURAGE vs. FAME2 and see how that correlated with decision making.
Some of you are saying, wait, wait! This study has OUTCOMES. Real honest to goodness outcomes. That is true. But these are observational, non-randomized outcomes.
But even worse, I’m pretty sure they are analyzed and/or reported incorrectly.
But even worse, I’m pretty sure they are analyzed and/or reported incorrectly.
First, let me say that the methods have almost no information about how the outcomes data were analyzed. This is the sum total of the statistical methods.

Seems like they took this paper which inspired many on the twitterverse but rightly inflamed @cecilejanssens (and me) too seriously:
Back to the ADVANCE CT-FFR registry. I have no idea how the survival regression and HR were calculated. Simple Kaplan-Meier method or some sort of regression?
Pshaw, methods don't matter. Lets get down to the results!
So let’s start with the actual numbers.

Wow!! A hazard ratio of 20 for MACE and 15 for death or MI. Wow. Few things are that effective.
For comparison, I reverse engineered that the polygenic risk scores that have been all over the @nytimes and @Forbes have an OR of about 1.65 for CAD.
This is surely much more revolutionary! VCs, load up the truck for @HeartFlow stock!
@DShaywitz
This is surely much more revolutionary! VCs, load up the truck for @HeartFlow stock!
@DShaywitz
Wait a second you say. This is just way too good to be true.
It is too good to be true. First, half of the MACE events were death!
10 deaths in the first 90 days of follow-up. I find it hard to believe that PCI in the setting of low-risk, stable, atypical symptoms saves that many lives in such a short period. Maybe I've hung around with @DavidLBrownMD too much.
This has to be play of chance.
This has to be play of chance.
Let’s look at the results more deeply. Here is the survival curve by CT-FFR for MACE (left) and Death/MI (right).

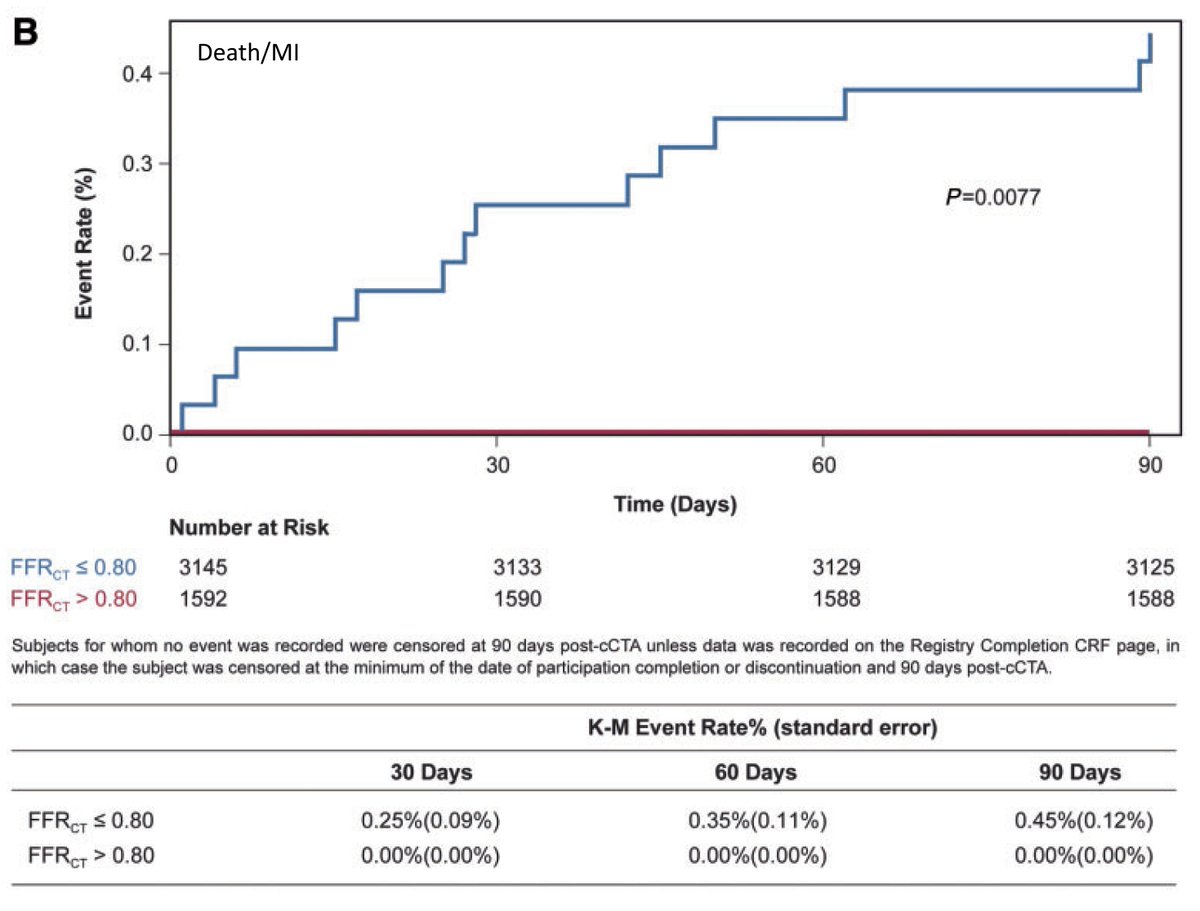
First, the low CT-FFR group are dropping like flies with a 60% MACE rate at 90 days in the CT-FFR <0.80 arm. This is so high as to question the validity of the study itself.
But it goes deeper. There appear to be zero events in the CT-FFR>0.80 arm. None. Zippo.
That generally means a hazard ratio where CT-FFR>0.80 is the denominator is something divided by zero. This cannot be calculated. It is undefined. I’d love for the stats gurus like @ADAlthousePhD and @f2harrell to correct me.
Let's dig deeper shall we?
Take a look at that abstract again…

Does something look funny?
Notice that the HR for death MI has a p=0.039 but the CI is 0.88-246. The silly wide Cis are because this is a grossly under-powered study. The fact that the Cis cross 1.0 but the P<0.05 says something is probably amiss. One is likely wrong.
But it is worse, p-values don’t match figures w/ K-M curves, either! It is possible because different methods in each, but the methods don’t help clarify this and the results text that ties into the figures is consistent with the abstract and inconsistent with the figures.


So what do we have with this study? Let's sum up...
Point #1: Its a psychology experiment saying docs are prone to subtraction anxiety.
(An interesting control here would have been to provide purposefully wrong CT-FFR values and see what happens – do doctors allow a magical number to overrule common sense in the absence of good RCT data?)
Point #2: We have a severely under-powered, non-randomized study which shows a irrationally high event rate in the low CT-FFR arm (of which half-ish are likely incorrectly estimated and have a “normal” invasive FFR).
Point #3: The statistical analysis itself is almost certainly either wrong or very sloppily reported.
Does this paper deserve to be a late breaker at @escardio #ESCCongress and get simultaneous publication in @ESC_Journals EHJ?
(A) Yes! CT-FFR Rulez, Venk droolz
(B) Not so sure
(C) Probably rushed
(D) Never
(A) Yes! CT-FFR Rulez, Venk droolz
(B) Not so sure
(C) Probably rushed
(D) Never
Personally, I think the drive for simultaneous publication & late-breaking clinical studies puts tremendous and undue pressure on peer reviewers that may substantially lessen quality.
This really should be evaluated in a trial.
This really should be evaluated in a trial.
. @djc795 has corrected a #ReadingComprehensionFail of mine. These graphs show event rates less than 1% in the CT-FFR<0.80 arm! I was silly and didn't catch that the scale is 0.4% and not 0.4 probability. That makes this even funnier though!

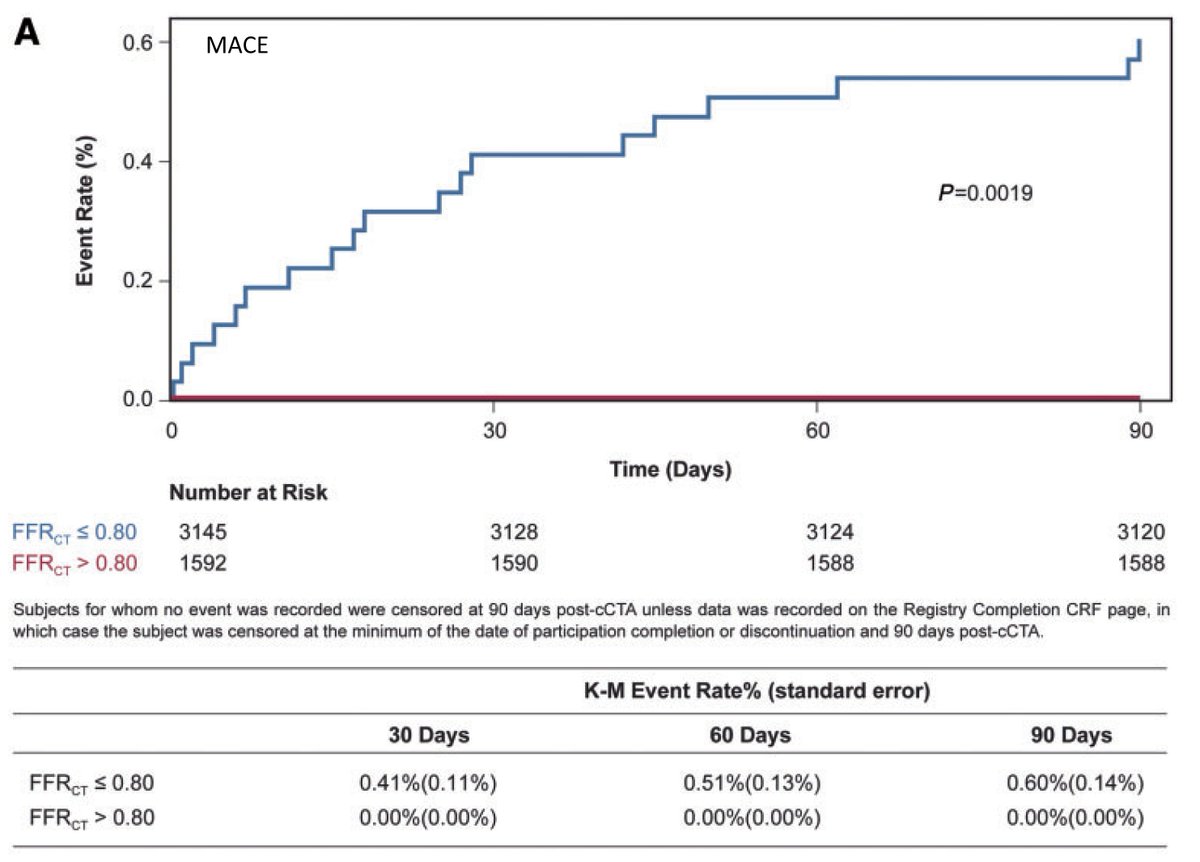
Of course, my points above about unreasonably high event rates are hereby officially withdrawn.
But all the other points about driving treatment decision making remain and become even more funny when the event rate in the supposedly sick group is extraordinarily low.
But all the other points about driving treatment decision making remain and become even more funny when the event rate in the supposedly sick group is extraordinarily low.
The statistical confusion/inconsistency also is unchanged.
Was this thread helpful?