
Nice review of the media coverage and its problems related to @Apple watch with added clarity about data @US_FDA used to approve from @thejoyvictory at @HealthNewsRevu.
Must read.
Updated tweetatorial showing just how bad the PPV might below.
healthnewsreview.org/2018/09/what-d…
Must read.
Updated tweetatorial showing just how bad the PPV might below.
healthnewsreview.org/2018/09/what-d…
Are you interested in understanding just how bad @Apple watch's false positive rate might be?
1. Yes
2. No, it's AHA endorsed and cool
3. Other
1. Yes
2. No, it's AHA endorsed and cool
3. Other
So, as several folks have reported, there were two studies sent to the @US_FDA . One was of 588 individuals, approximately half with AF who had a reference ECG (presumably 12 lead) and a Watch ECG. This is at a single time point, I'm guessing from context.
10% of the Watch ECGs were not classifiable. This is a pretty high rate. In the remaining 90%, the sensitivity was 98.3% and the specificity 99.6%. These are very good numbers.
However, we don't know if the 10% that were not classifiable were evenly distributed among the half with AF and the half without AF or whether these were predominantly AF or not.
Furthermore, we don't know if a second attempt immediately after would have fixed many or any of these failures. (or whether this was already a second attempt). Of course @Apple and probably @leftbundle know but they aren't saying.
My esteemed colleague @skathire has already calculated the positive predictive value of the watch from this first experiment using data from the first report with @US_FDA data from @sheridan_kate at @statnews.
statnews.com/2018/09/13/her…
statnews.com/2018/09/13/her…
Here is his tweet on the matter:
Turns out there is a minor error in his math and the positive predictive value is actually about 55% not 45% if 1 in 200
For those who aren't familiar, the positive predictive value or PPV is the fraction of abnormal studies that are truly abnormal. In other words it is the number of true positives divided by the sum of (true positives + false positives).
If you calculate based on the first experiment what the PPV for the @Apple watch is across a range of prevalences for AF, you can make this figure.
Prevalence = percent of people in the population with condition, in this case AF.
Prevalence = percent of people in the population with condition, in this case AF.
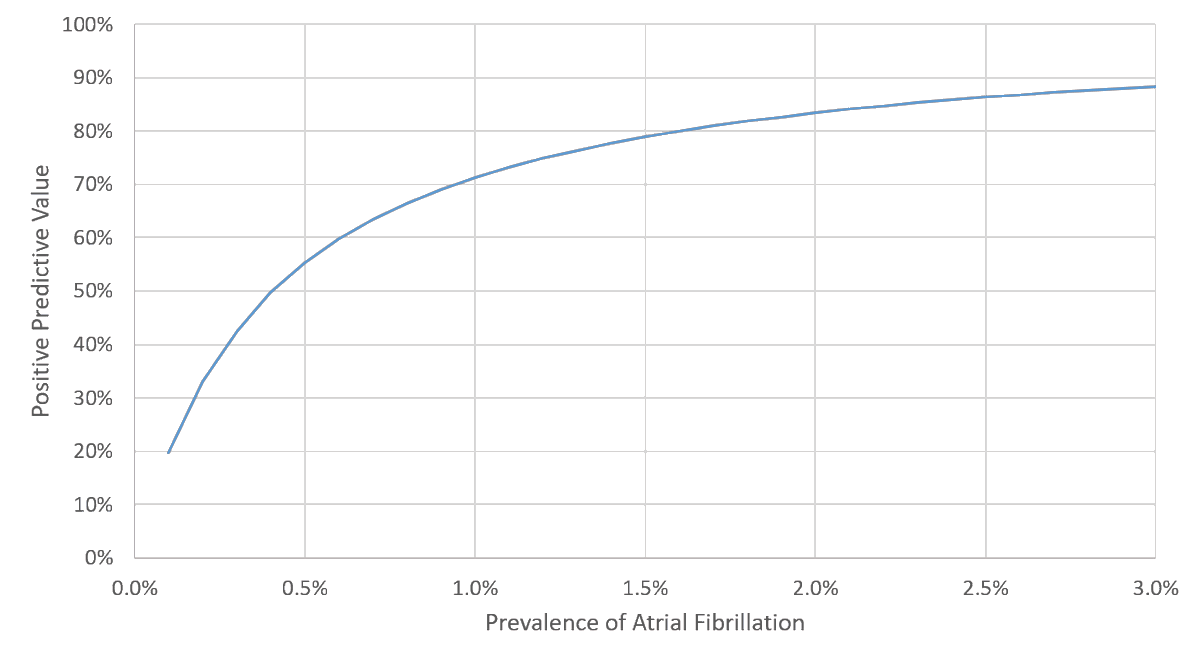
So while the PPV is relatively bad (about half) in really healthy populations, once you start looking at populations where AF is more common, its not all that terrible.
All good right?
All good right?
Yes! Now we can sell lots and lots of @Apple watches. All the hand wringing was unwarranted, right?
1. Of course @venkmurthy and others over worried. @Apple awesome and @American_Heart know best
2. Ha ha, it gets worse
3. Bring @ProfDFrancis back
1. Of course @venkmurthy and others over worried. @Apple awesome and @American_Heart know best
2. Ha ha, it gets worse
3. Bring @ProfDFrancis back
Now being able to produce a 1 lead rhythm strip in folks who need it isn't a bad thing. Apple actually seems to have done that pretty well. I'm pretty sure the numbers won't hold up so well in future trials, but still good enough, perhaps.
It does get worse though.
It does get worse though.
There is a second study. In this second study, 226 people who all had been previously notified by their watch that they had an irregular rhythm (not necessarily AF because this is the approval for the irregular beat sensing software not the ECG software).
We don't really know who these people are, but I suspect they were enriched for people at higher risk for AFib.
So these 226 people were then given a 6 day ambulatory cardiac monitor. We aren't sure what kind though. Probably some form of a Holter monitor.
This is the @American_Heart page on what is a Holter monitor:
heart.org/en/health-topi…
This is the @American_Heart page on what is a Holter monitor:
heart.org/en/health-topi…
During that time, the people wore the Holter *and* the @Apple watch. The Holter was the "gold standard".
41.6% of participants had AF on the Holter monitor during the 6 days of monitoring.
What percentage didn't have AF during the 6 days? (pick the closest)
What percentage didn't have AF during the 6 days? (pick the closest)
In one sense, this could be considered a false positive rate.
If you didn't have AF on the gold standard Holter over six days but you did have irregular rhythm on the Watch, the Watch might be wrong... almost 60% of the time.
If you didn't have AF on the gold standard Holter over six days but you did have irregular rhythm on the Watch, the Watch might be wrong... almost 60% of the time.
But that's not totally fair, its possible that AF happened earlier and the watch was right but it didn't happen during the 6 day Holter period. Anyone who has ordered or worn a Holter will tell you this is frustratingly common.
That said, if there is zero AF over 6 days *at all* presumably you aren't having all that much AF and in these cases it often isn't at all clear whether treatment benefits outweigh risks.
But wait, we can go further. There is more here and it gets worse...
So we can't rewind time and go back and see what happened in those people with a normal Holter but an abnormal watch reading. But we can see what happened DURING the Holter because the patients wore both.
So this second study over six days of Holter monitoring had 226 participants and 41.6% of them had AF during that time.
I don't like working with numbers like 226 because they make mental math hard. Let's just pretend for a second that they study was of 1000 people.
I don't like working with numbers like 226 because they make mental math hard. Let's just pretend for a second that they study was of 1000 people.
Let's pretend that this study had exactly the same proportions as the 226 patient study.
In this case 41.6% of the 1000 people had AF. So how many people had AF?
In this case 41.6% of the 1000 people had AF. So how many people had AF?
I'm going to wait a bit for folks to catch up. It'll get more exciting so please stay engaged.
After enough people vote in the above questions, I'll move forward. So if you want to see the rest, please retweet!
@purviparwani @bogdienache @MDaware @DGlaucomflecken
@purviparwani @bogdienache @MDaware @DGlaucomflecken
Only a few votes, but people are mostly right!
Next statistic. We are told that the proportion of people who the watch noted AF during the 6 day Holter period who also had AF on the Holter was 78.9%.
Next statistic. We are told that the proportion of people who the watch noted AF during the 6 day Holter period who also had AF on the Holter was 78.9%.
We don't know what proportion the watch said normal and the Holter said AF or vice versa. We also don't know what proportion both said normal.
Ideally, @Apple @leftbundle or @Stanford who were all involved with generating this data would release the full data and it would be peer reviewed.
The key numbers would be to fill in this table called a 2x2 table
The key numbers would be to fill in this table called a 2x2 table

We can start filling it out based on what we know. But in this case, let's use 1000 for the total number of subjects for easier math.
We start by putting the total number of subjects in the lower right.

Next step, we enter the total number of people who had AF on the Holter. 83% of people got this right at 416.

Now, how many people did not have AF on the Holter?
You can get this by taking the total number of people (1000) and subtracting the ones that had AF on Holter (416).
You can get this by taking the total number of people (1000) and subtracting the ones that had AF on Holter (416).
Answer the above question for yourself before moving forward. Answer in the next tweet.
So here is the answer.

My next move would normally have been to use the sensitivity to calculate the numbers in the top row.
Sensitivity is the fraction of all people who are truly abnormal (AF on Holter) that are identified as abnormal by the test.
In other words it is "X" divided by 416.
Sensitivity is the fraction of all people who are truly abnormal (AF on Holter) that are identified as abnormal by the test.
In other words it is "X" divided by 416.

We don't know what sensitivity in this experiment was. I'm going to give @Apple the benefit of the doubt and guess it was the same as in the first experiment mentioned above (98.3%). This is quite high and it very well could be lower (slight chance it was even higher).
So sensitivity = x / 416.
X = 416 * sensitivity = 416 * 98.3 This is 409 (rounding partial people).
So the watch called AF in 409 out of 416 people that the Holter (gold standard) found AF.
X = 416 * sensitivity = 416 * 98.3 This is 409 (rounding partial people).
So the watch called AF in 409 out of 416 people that the Holter (gold standard) found AF.

You may be wondering why I'm not using the 78.9% number. This was the frequency that the Holter confirmed AF when the watch called irregular rhythm when they were on during the same six day period.
This is actually the PPV (Positive Predictive Value). Pretty darn good, right?
This is actually the PPV (Positive Predictive Value). Pretty darn good, right?
Most docs & patients really want to know the PPV ("doc, is this test for real?")
Most statisticians hate PPV because it isn't constant across populations. It depends heavily on how frequent the disease is in a population.
Most statisticians hate PPV because it isn't constant across populations. It depends heavily on how frequent the disease is in a population.
Statisticians prefer specificity and sensitivity over positive and negative predictive value because they are more constant across populations (assuming test done the same way).
So let's try to calculate the PPV in a population that looks like watch customers with 1 in 200 or 1 in 100 with AF.
To do this, we need to fill out the rest of the square and calculate the specificity. (we've made a guess at the sensitivity).
So, let's get back to the square! Let's try to fill in that last blank in the top row.

We know that the total is 416 and the left upper box is 409 so the right upper must be 416-409=7

Now what do we do??
Well we are going to use that positive predictive value of 78.9%. The PPV is the fraction of people who the Holter confirmed in AF out of all of the ones that the watch said AF.
PPV = 409 / X
Rearranging: X = 409/PPV
Well we are going to use that positive predictive value of 78.9%. The PPV is the fraction of people who the Holter confirmed in AF out of all of the ones that the watch said AF.
PPV = 409 / X
Rearranging: X = 409/PPV

So X = 409 / 78.9% = 409 / 0.789 or about 518 (again rounding out fractions)
Filling in 518 for the total in the left column. Can you subtract and fill in the lower left box?
Filling in 518 for the total in the left column. Can you subtract and fill in the lower left box?

Here it is 518-409=109

As a last step, you can do the remaining subtractions and fill in the last two blanks.

Finally! We have filled in the square.
Specificity is the fraction of people who don't have the disease (all Holter no AF) that the Watch also says no AF.
What is that?
Specificity is the fraction of people who don't have the disease (all Holter no AF) that the Watch also says no AF.
What is that?
I'm going to wait to see what people say, but if you are unsure, please see this really nice wikipedia article on sensitivity
en.wikipedia.org/wiki/Sensitivi…
en.wikipedia.org/wiki/Sensitivi…
First two people got it wrong.
Let's do this step by step. How many people does our gold standard Holter say don't have AF?
Let's do this step by step. How many people does our gold standard Holter say don't have AF?
How many people does the watch say no AF and the Holter say no AF?
So specificity is (# people who watch says no AF and Holter says no AF) / (Holter says no AF).
So let's try that question again. The specificity is:
We are almost there. I promise. There will be some extremely interesting (and mighty bad) numbers related to the long term screening for AF.
Looks like people are getting it. The specificity is 475/584 = 81.3%
This is a moderate specificity. Many medical tests are in this range.
This is a moderate specificity. Many medical tests are in this range.
Now we assumed the sensitivity to be high at 98.3%. If we drop this down to 90%, the specificity changes a bit too and goes up to 82.9%.
A very minimal increase despite a substantial drop in sensitivity.
A very minimal increase despite a substantial drop in sensitivity.
The problem is that specificity in this range is not good enough to test low risk populations. It generates very, very low positive predictive values and very high false positive rates.
I will spare you all the math, but the process is exactly what you have done above but with new assumptions.
Here is a table of the Positive Predictive Value and False Positive Rate (1-PPV) among apple watch users depending on the rate of AF within that group.

He are graphs of PPV and false positive rate as a function of how common AF is among @Apple watch customers.
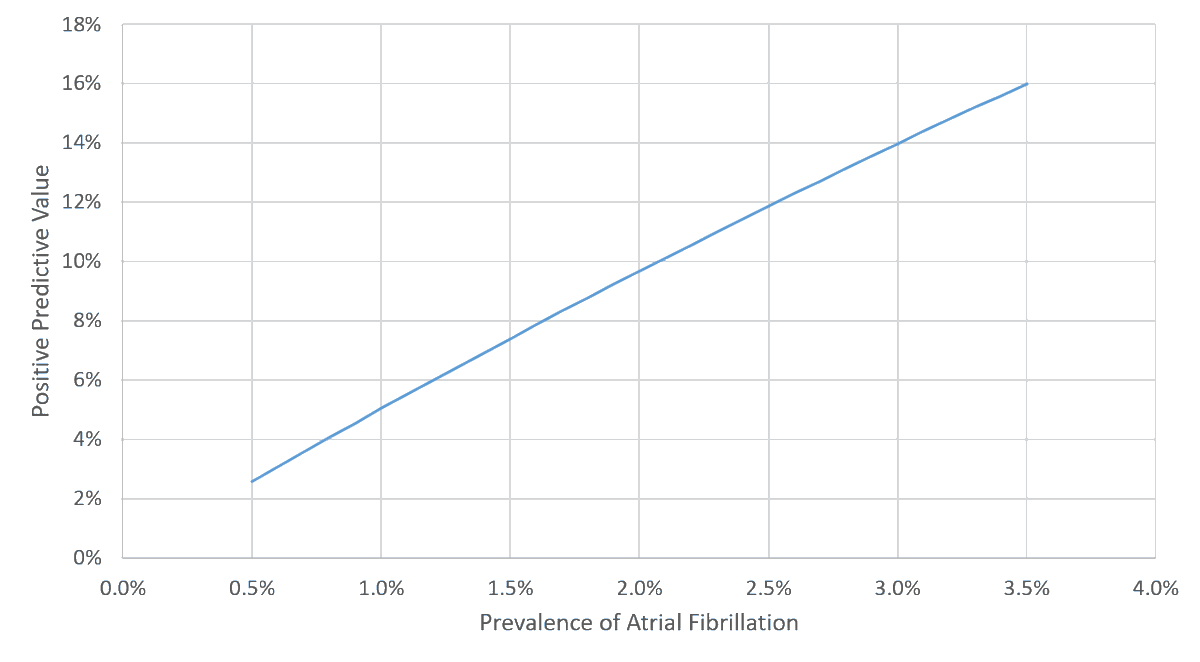
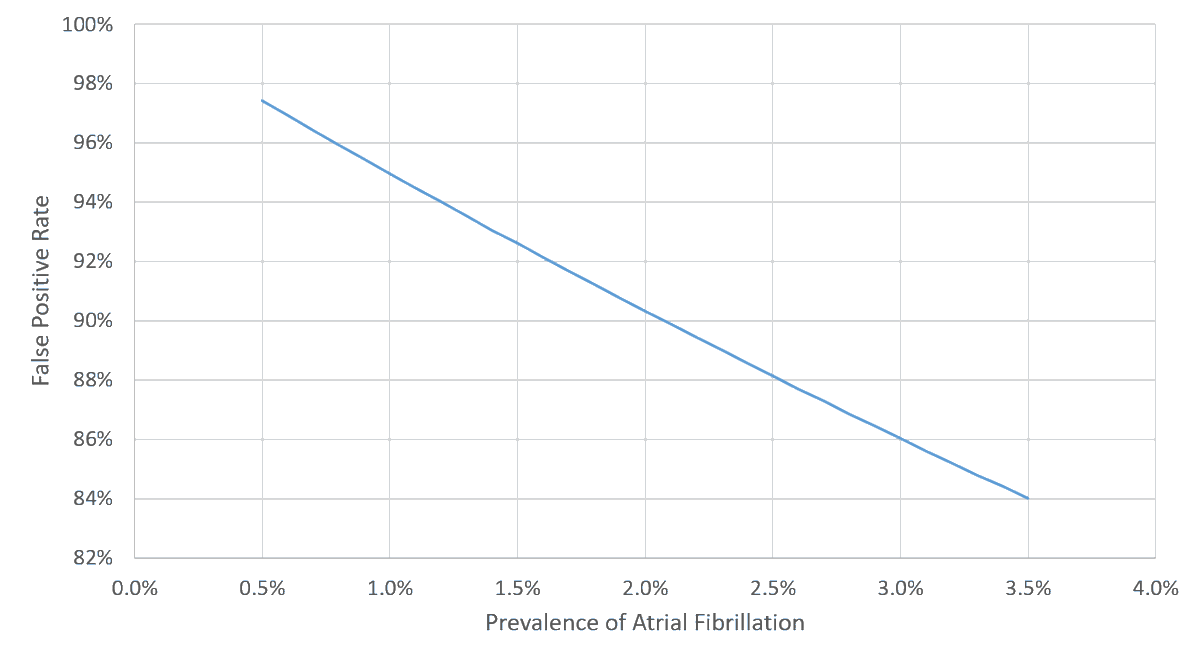
So for a 1% rate of AF in the @apple watch user population, 95% of the irregular HR readings will be false positives.
So we will worry 19 people for every 1 that has AFib. Does this seem like a good trade off to you?
So we will worry 19 people for every 1 that has AFib. Does this seem like a good trade off to you?
But it got an endorsement from the @American_Heart so it must be good? Why oh why did they endorse?
A few caveats: these data are from @US_FDA via @thejoyvictory. I can't vouch for their accuracy. Lots of details are missing and things could change a bit.
Was this helpful?


