1/ As a pure data-driven exercise, Thursday (9/20/18) & immediate region are textbook candidates for a market peak based on convergence of valuations, internals & daily technicals. Not calling "sell" - investors can't get out in aggregate & minds are already made up. Read on... 

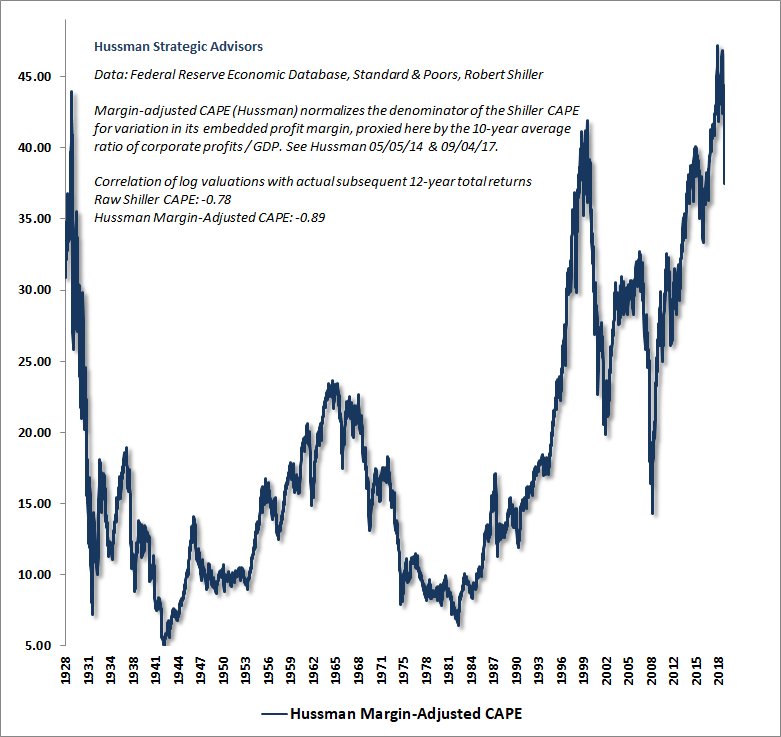
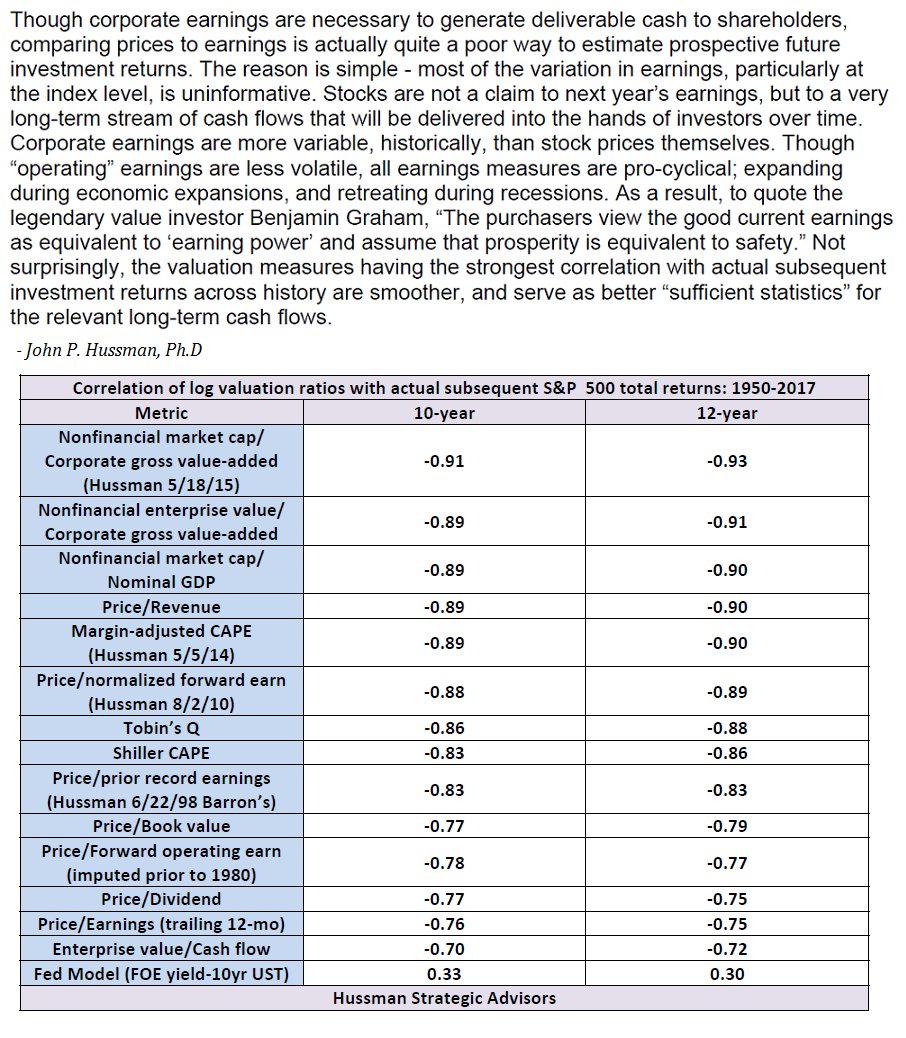
2/ Starting from the wide-view, the most reliable valuation measures (those best correlated with actual subsequent mkt returns) are at historic extremes. Valuations are highly informative about long-term and full-cycle outcomes, but they can be useless over shorter segments...

3/ So despite the tight correlation of good valuation measures with actual subsequent market returns, valuations can be "wrong" for a long time. If high valuations were enough to stop rising markets, you'd never get hypervaluation like 1929, 2000 or today...

4/ Ah. Before we go on. You noticed those "errors" in the preceding chart, where actual 12-year returns were higher than valuations would have projected 12 years earlier. That's a clue that shorter-term market outcomes are driven by cyclical fluctuations in investor psychology...

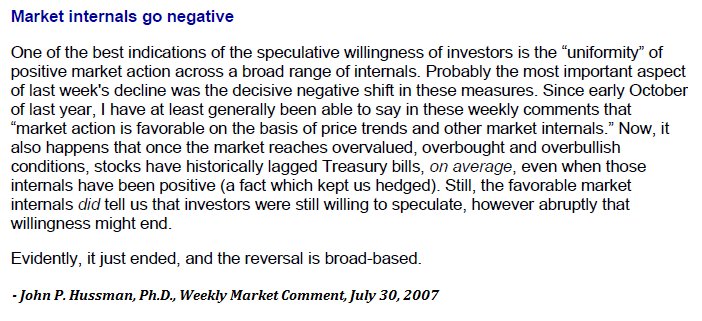
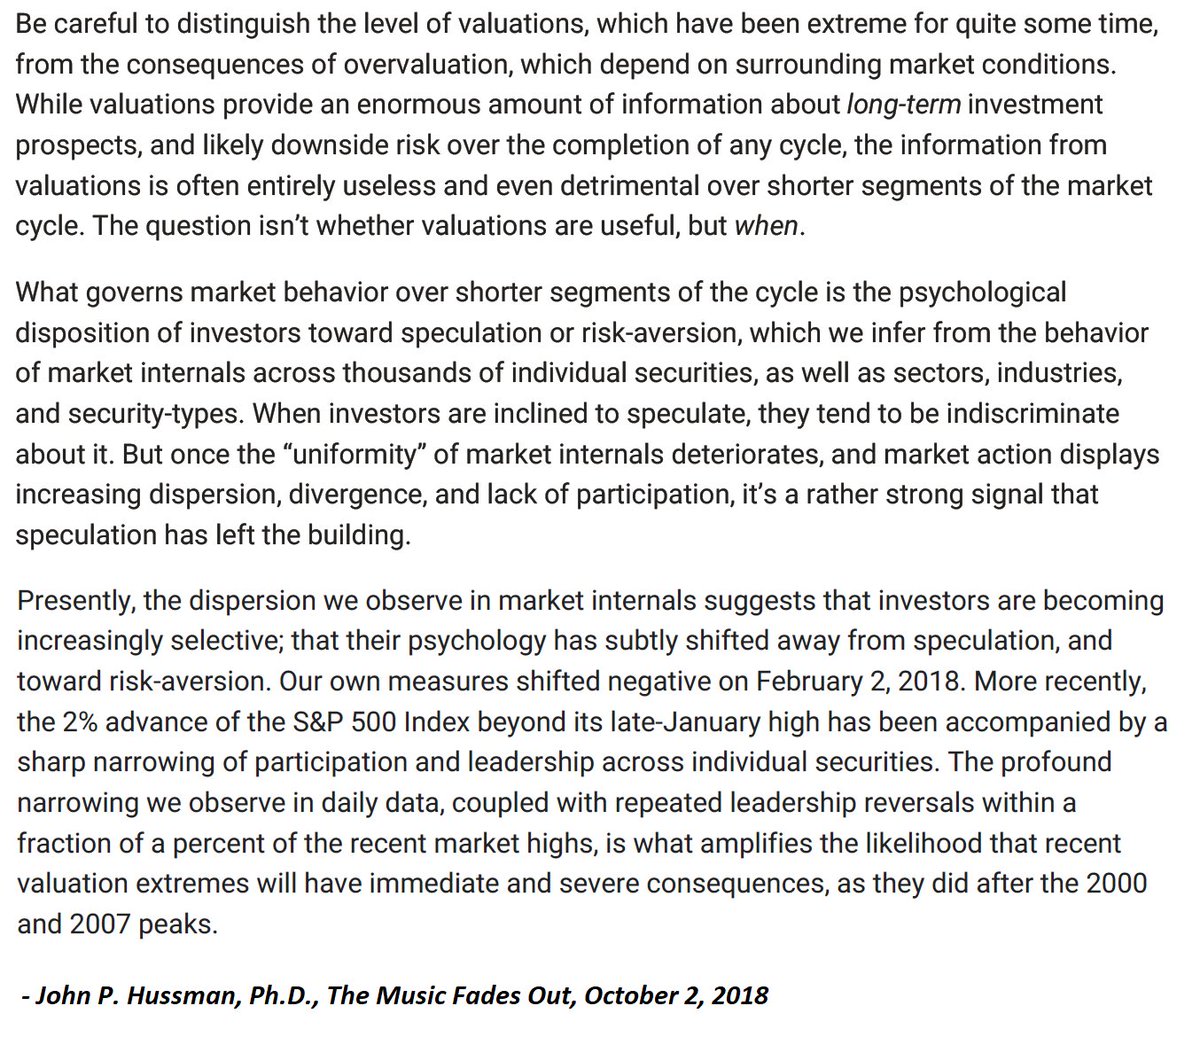
5/ But how to measure "psychology"? Now it gets interesting. You need something observable. When investors are inclined toward speculation, they tend to be indiscriminate about it, so uniformity or divergence of market internals across thousands of securities says a lot ...

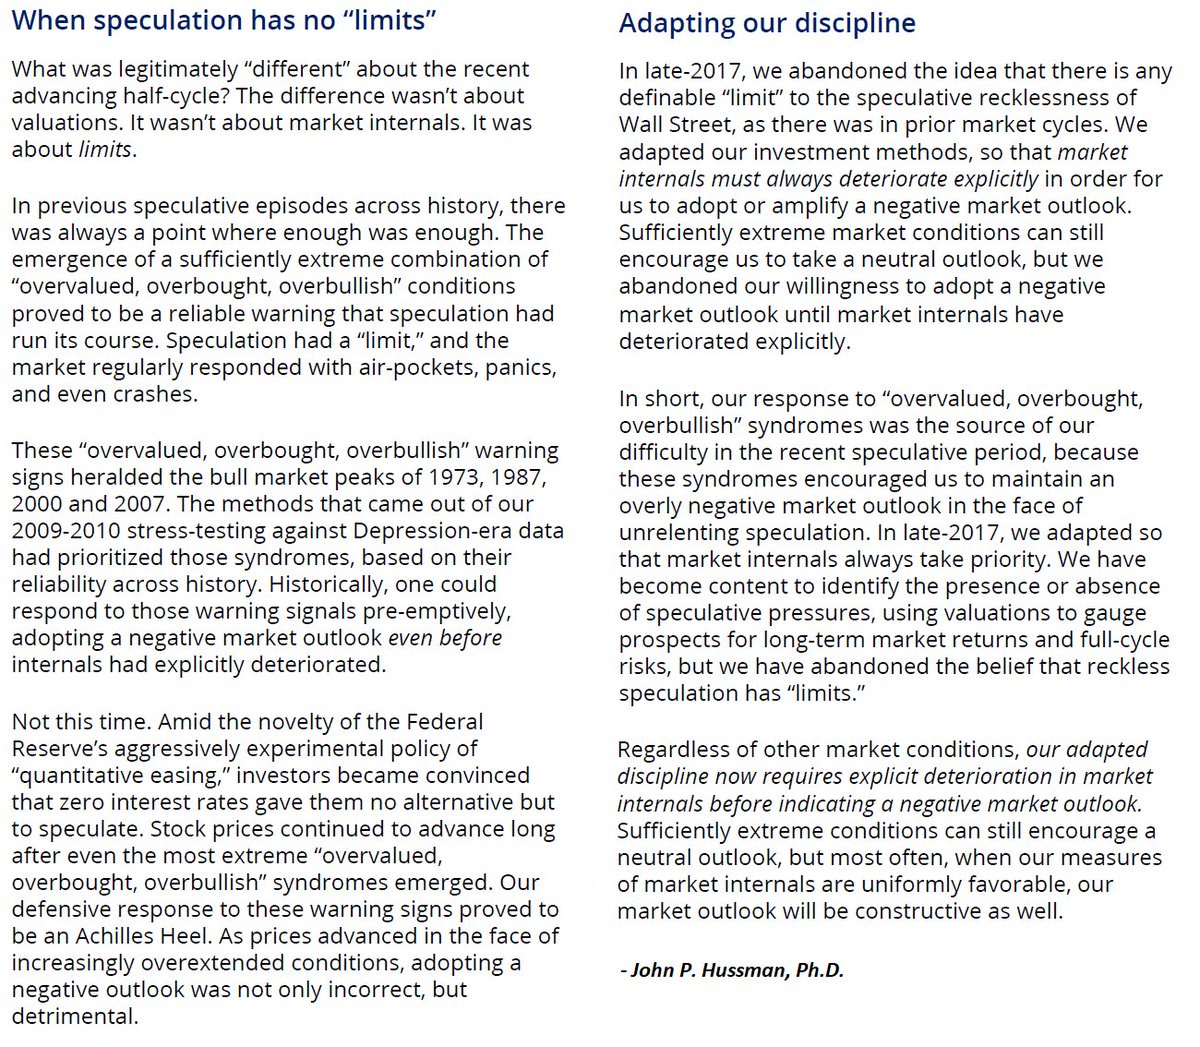
6/ Hold on. That chart of market internals looks like you did prior to 2009, but nothing like recent years. What the hell happened? Ok. Learn from my error. The inadvertent outcome of my 2009 stress-testing against Depression-era data was an emphasis on "overextended" syndromes..

7/ Back to internals. Good valuation measures are wildly informative about long-term and full-cycle outcomes, but can be useless over shorter segments. The rule, inadvertently proved by my 2009 stress-testing stumble, is to defer a bearish stance until internals deteriorate.

8/ Same in 2007. You can be neutral when the market is sufficiently overextended, but withhold a negative outlook until internals deteriorate. Overextended conditions used to be enough, but not in a world of QE, ZIRP and increasingly extreme policy initiatives...

9/ Ok, so our own measures of market internals went negative on Feb 2, 2018. At that point, a trap door of risk opened below the most extreme valuations in history. How extreme? A run-of-the-mill completion of this market cycle would wipe out roughly 2/3 of the market's value...

10/ Two thirds of the market's value? That's preposterous. Yeah. I've heard that before. By the way, the tech-heavy Nasdaq 100 lost an implausibly precise -83% of its value between 2000 and 2002...

11/ Yeah. The additional round of Fed-driven yield-seeking speculation in this half-cycle was more extreme than the housing bubble, because it focused speculation not only on mortgage debt but the entire securities market. Sadly, valuations are always ignored in the short-term...

12/ So here's the situation. Valuations are extreme, and internals have deteriorated. If internals improved, even MY near-term outlook would shift neutral or constructive w/ a safety-net. But we don't have that here. Again, internals have nicely navigated even recent QE years...

13/ So given that we've got this open vulnerability defined by extreme valuations and unfavorable internals, it then becomes useful to look at finer dispersion in daily data, which often correlates with market peaks...

14/ … Under those conditions, a finer thing we can examine in daily data is the frequency of days where the market indices are still elevated, but we see dispersion in leadership (highs vs lows) and ragged participation (fewer stocks in rising trends)...

15/ ... we can also restrict our attention to periods of negative market internals and overvaluation (to any extent at all), and keep a tally of short-term and cyclical factors in technical, fundamental, sentiment, and monetary factors that are also frequently seen near peaks...

16/ … Side note here. While it looks like the market rose persistently between 1959-1970 despite constantly negative internals, that's an artifact of a 60-year chart. Good measures of internals (like many of their technical cousins) are intended to capture speculative periods...

17/ Internal dispersion, ragged participation, and multiple Hindenburgs alone are enough to say hmm... they don't really have the speculative bit in their teeth here. These things aren't some "lock" on market peaks, but they do provide insight about the uniformity of things...

18/… but again, if you combine long-term full-cycle valuations with intermediate factors like divergent market internals, consumer confidence (comfort is not your friend) & Fed-hikes, plus daily dispersion and leadership reversals, there's no point we've seen more at one moment.