,
35 tweets,
15 min read
Read on Twitter
The State of Working America.
The State of American Wages.
The latest trends in U.S. wages through 2018.
Wage inequality continues to rise, wage gaps persist and, in some cases, worsen, the college premium falters, and data reliability is at risk.
1/n
epi.org/publication/st…
The State of American Wages.
The latest trends in U.S. wages through 2018.
Wage inequality continues to rise, wage gaps persist and, in some cases, worsen, the college premium falters, and data reliability is at risk.
1/n
epi.org/publication/st…
It's a well established fact that rising wage inequality and sluggish hourly wage growth for the vast majority of workers has been a defining feature of the American labor market for four decades, despite steady productivity growth.
2/n
2/n
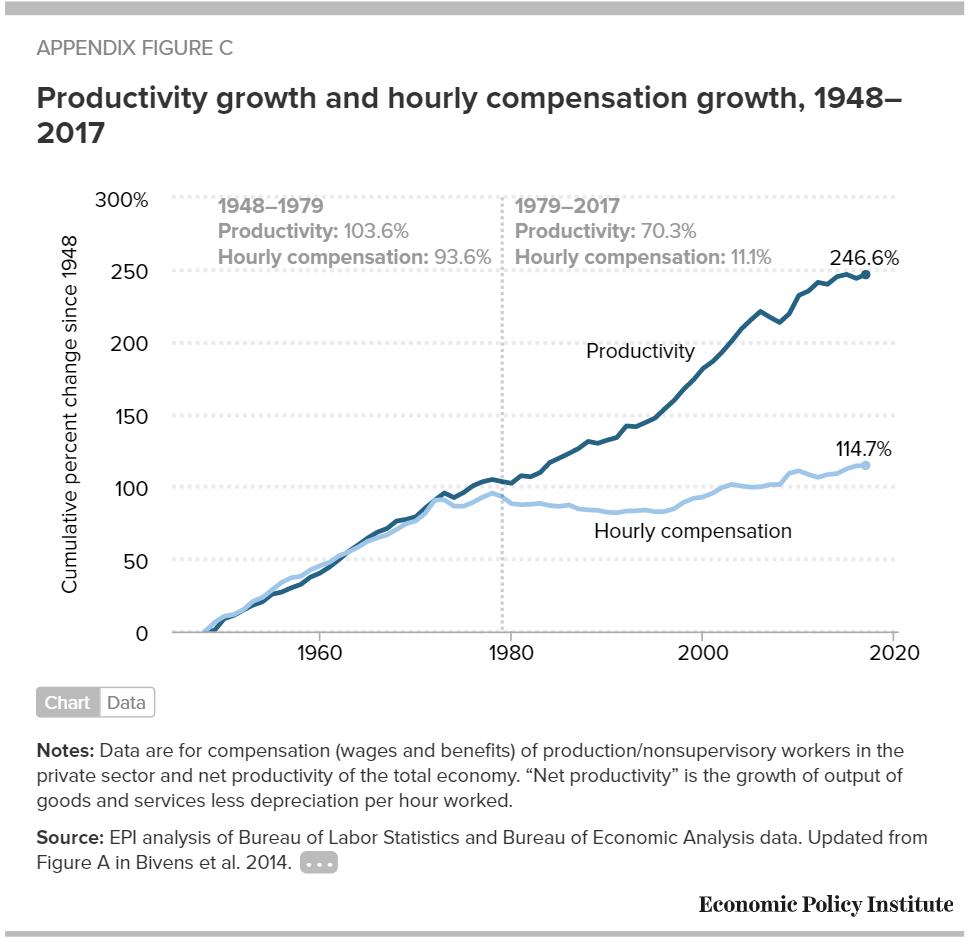
Over those four decades, the gains to a growing economy went to higher corporate profits and increased income accruing to capital and business owners. It also went to those at the very top of the wage distribution. The top 1% grew 157% while the top 0.1% grew a whopping 343%.
3/n
3/n

While the CPS-ORG (the data I'll be discussing with you today) doesn't allow a look inside the top 5% of the wage distribution, it's still instructive for measuring the growth in wage inequality over the last 40 years. The 95th percentile grew 4 times faster than the median.
4/n
4/n

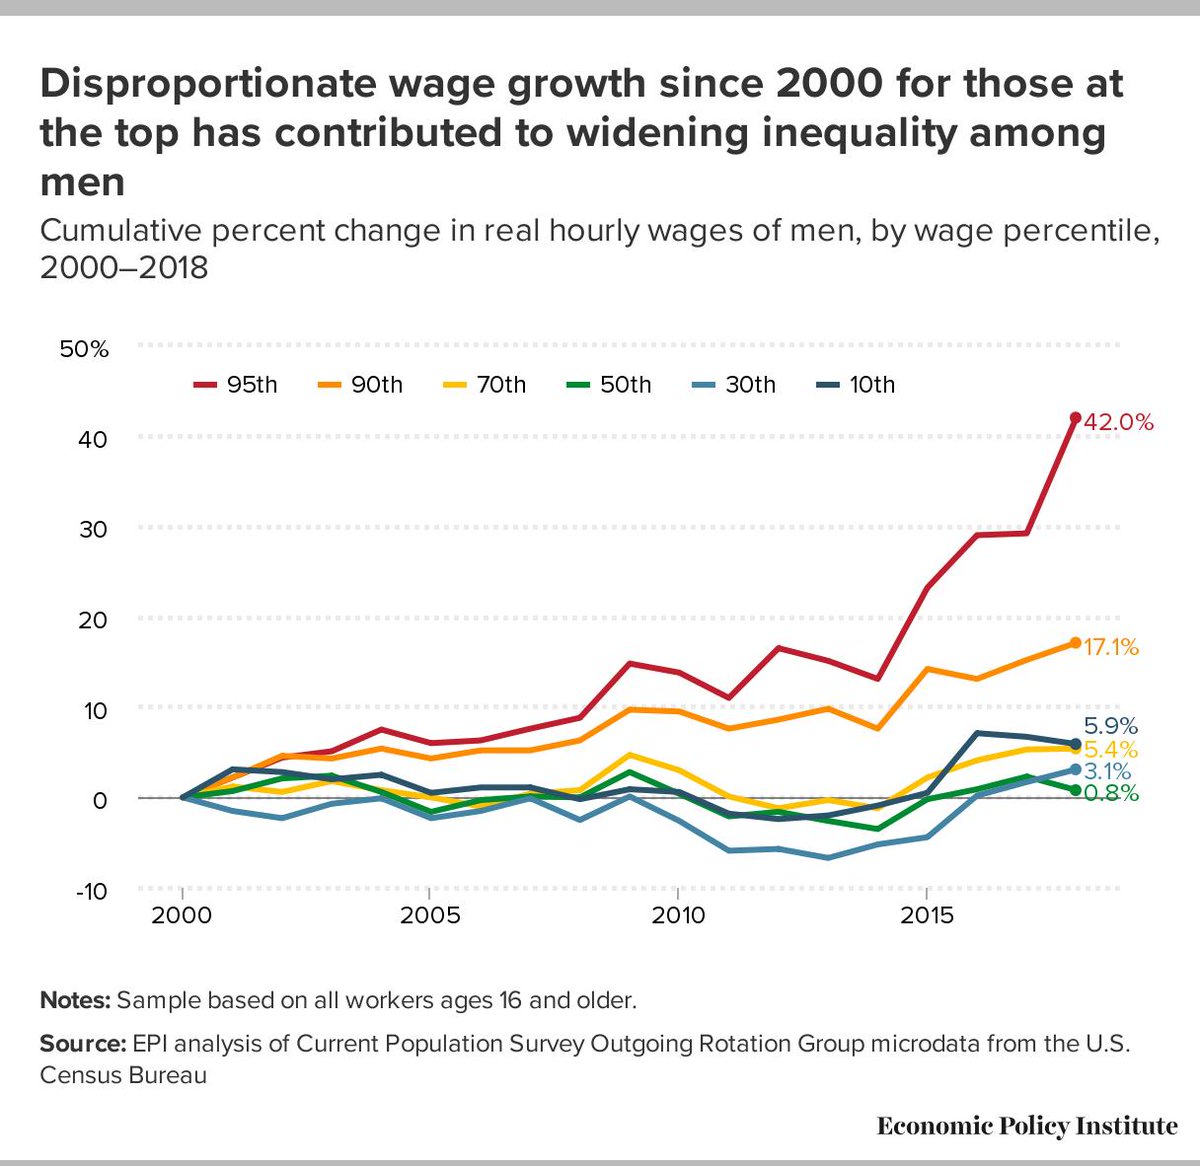
You might be thinking, we knew all that. Wage inequality is an established fact. You're right, @EconomicPolicy's been telling us this for years. But, did you know that it's actually getting worse?
5/n
5/n
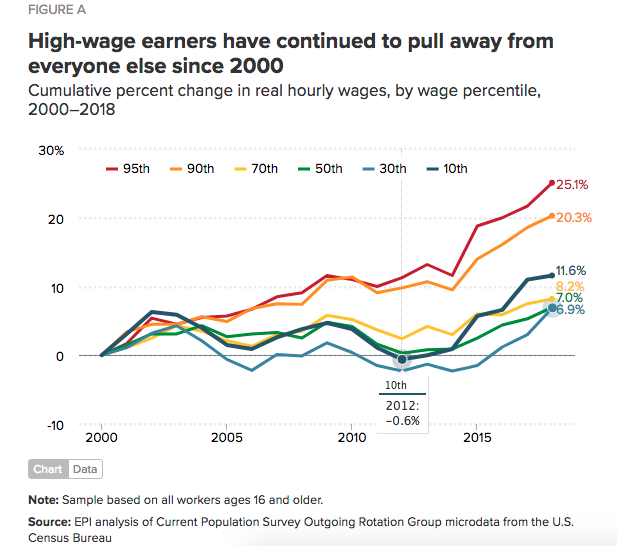
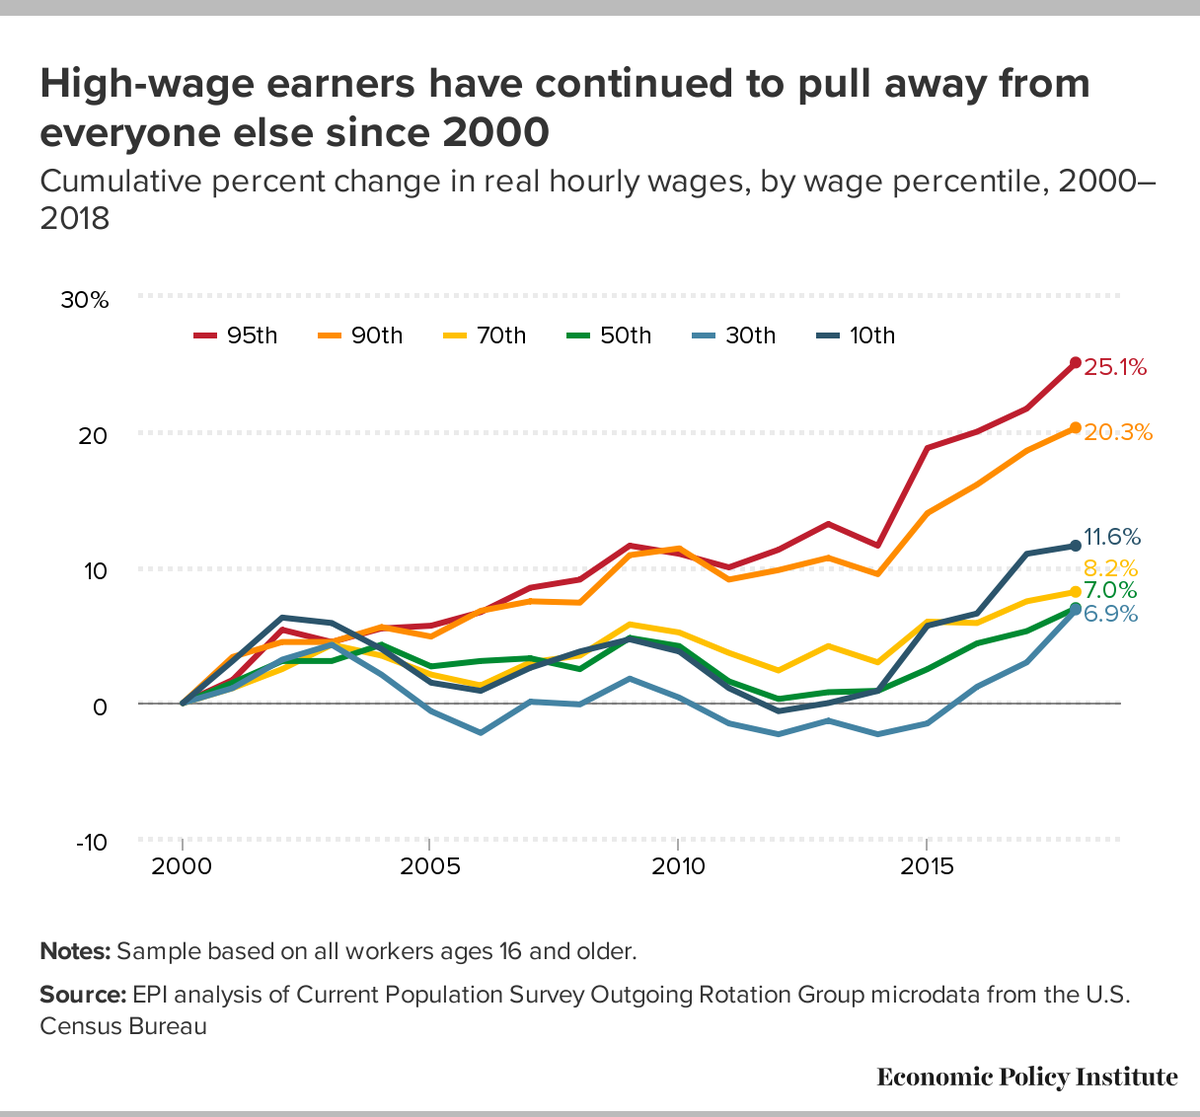
From 2000 to 2018, wage growth was strongest for the highest-wage workers, continuing the trend in rising wage inequality over the last four decades. The 95th percentile grew over 3 times faster than wages at the median.
6/n
6/n

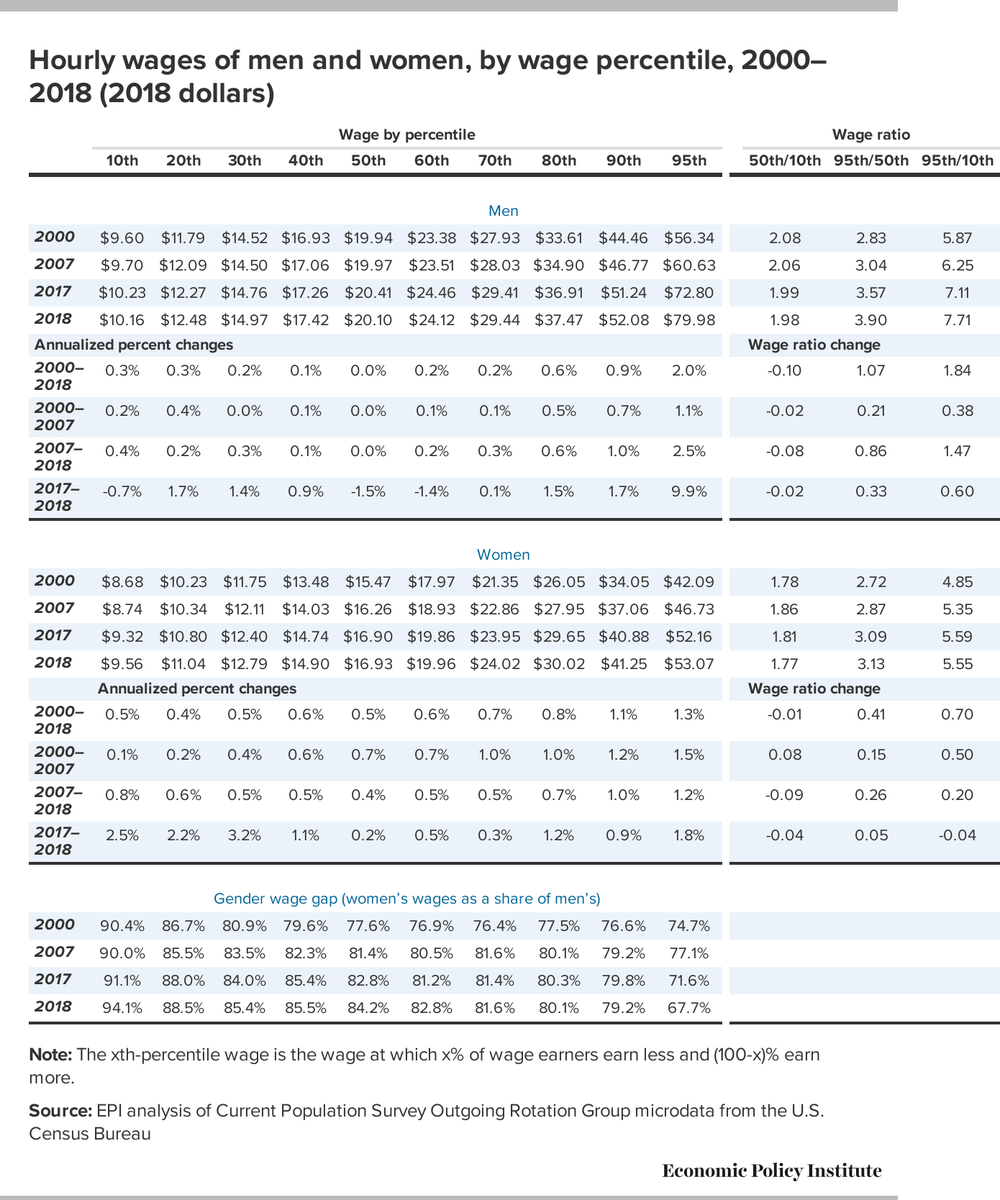
By 2018 the 95/10 wage ratio was 6.3 up from 5.6 in 2000. On an hourly rate, the 95th percentile wage earner was paid 6.3 times what the 10th percentile wage earner was paid. The same pulling apart occurred between top and middle earners; the 95/50 ratio grew from 2.9 to 3.4.
7/n
7/n

While wage inequality has generally been on the rise for both men and women, wage inequality is higher and growing more among men than among women.
8/n
8/n

While the gender wage gap remains significant, particularly at the top of the wage distribution, the gender wage gap at the median continued to shrink over the last year. The regression adjusted gender pay gap now sits at 22.6% (epi.org/data/#?subject…).
9/n
9/n
Brace yourself. I'm about to drop some good news.
10/n
10/n
Last summer, my colleagues @ben_zipperer and @joshbivens_DC wrote an important paper on the importance of locking in full employment. They find that the benefits of an extended period of high pressure in the labor market are large and progressive. epi.org/publication/th…
11/n
11/n
Notably, @ben_zipperer and @joshbivens_DC find that tighter labor markets disproportionately benefit low and moderate wage workers, those workers the most devastated by the depth of the Great Recession and its aftermath. 12/n
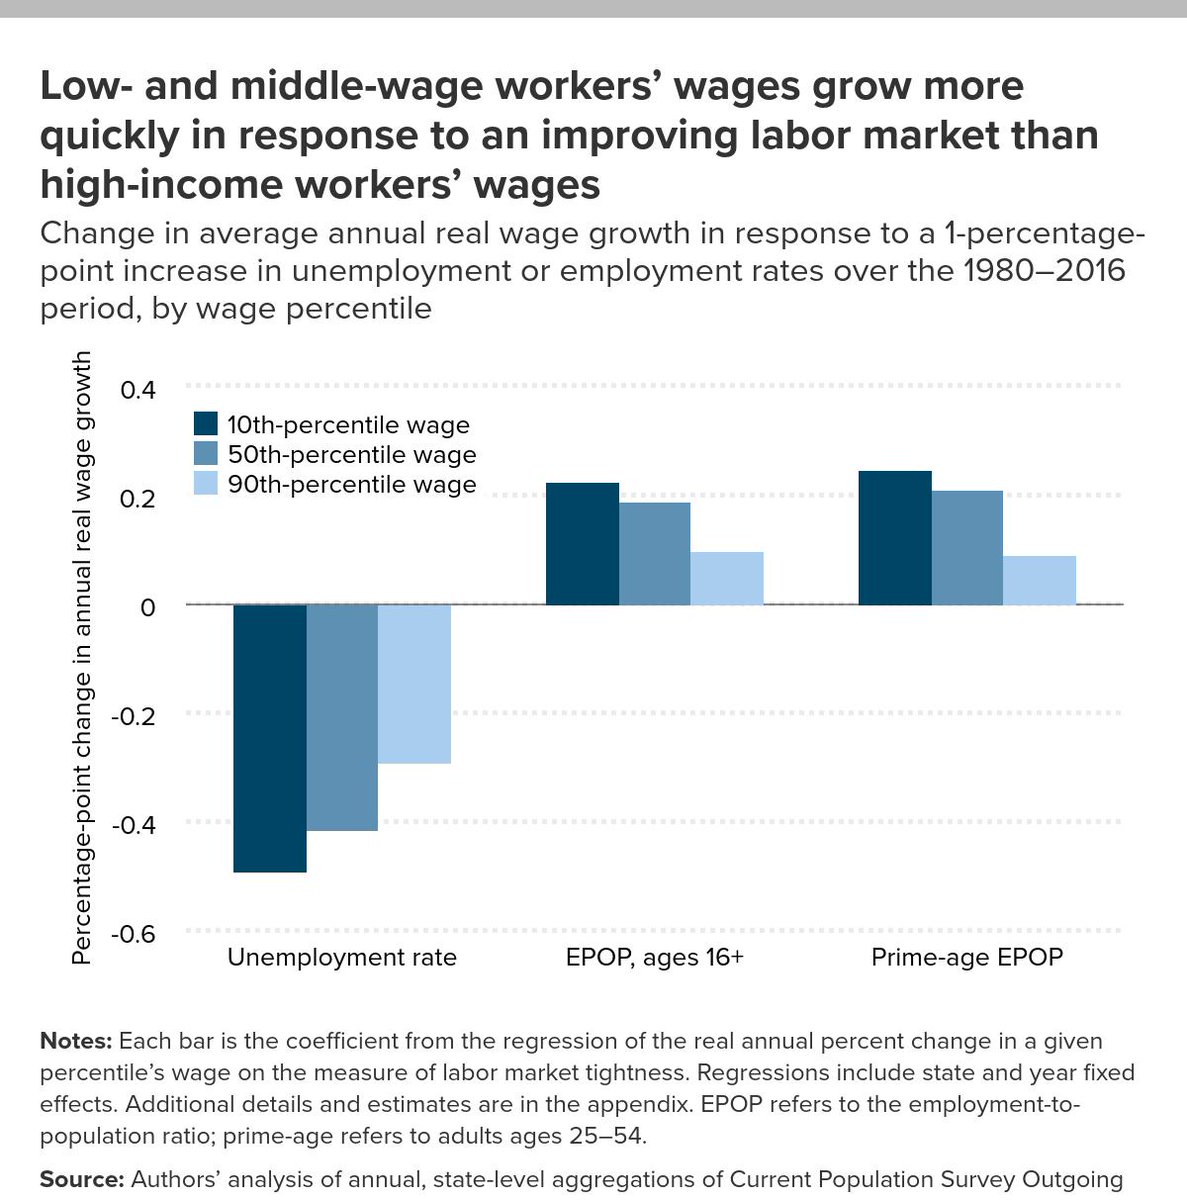
Unfortunately, in lieu of stronger labor standards and worker bargaining power, it takes tighter and tighter labor markets for typical workers to reap the rewards of a strong and growing economy.
13/n
13/n

But, here's the good news, persistently low unemployment is finally translating into stronger wage growth. We see some improvement, particularly in the last quarter, in the monthly wage series released by the BLS on jobs day each month.
14/n
14/n

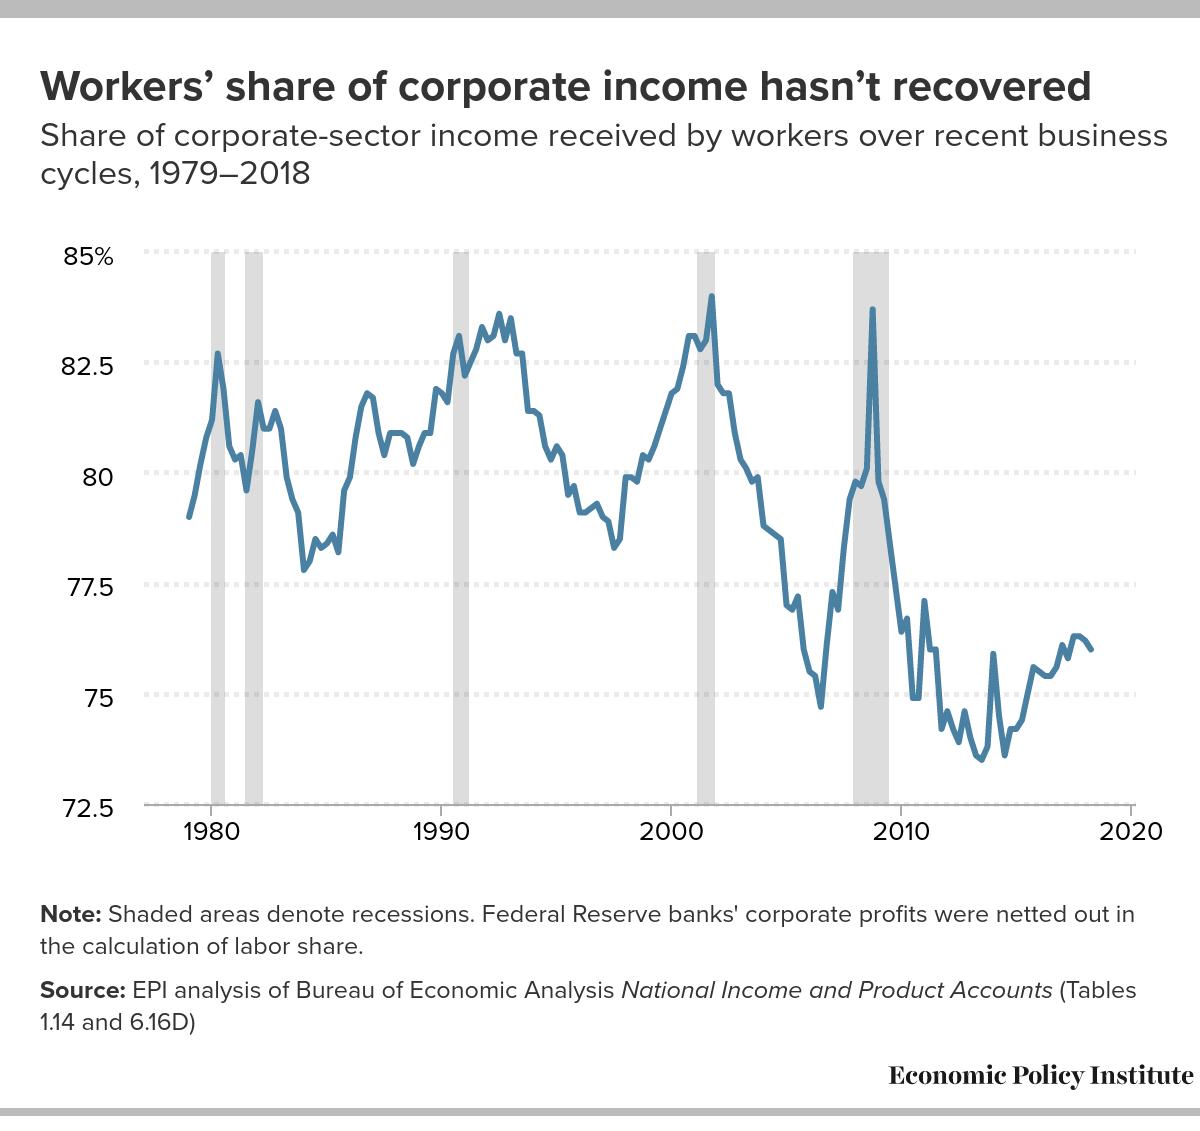
This is not to say that the economy has reached genuine full employment. Many workers are still just making up for large losses experienced in the Great Recession, rather than getting ahead. And, labor share still has a long way to go to recover.
epi.org/nominal-wage-t…
15/n
epi.org/nominal-wage-t…
15/n
A growing economy alongside state level minimum wage increases translated into stronger growth for the lowest wage workers in the economy today. Growth in the 10th percentile wage was particularly strong in the 21 states + DC that experienced a minimum wage increase in 2018.
16/n
16/n

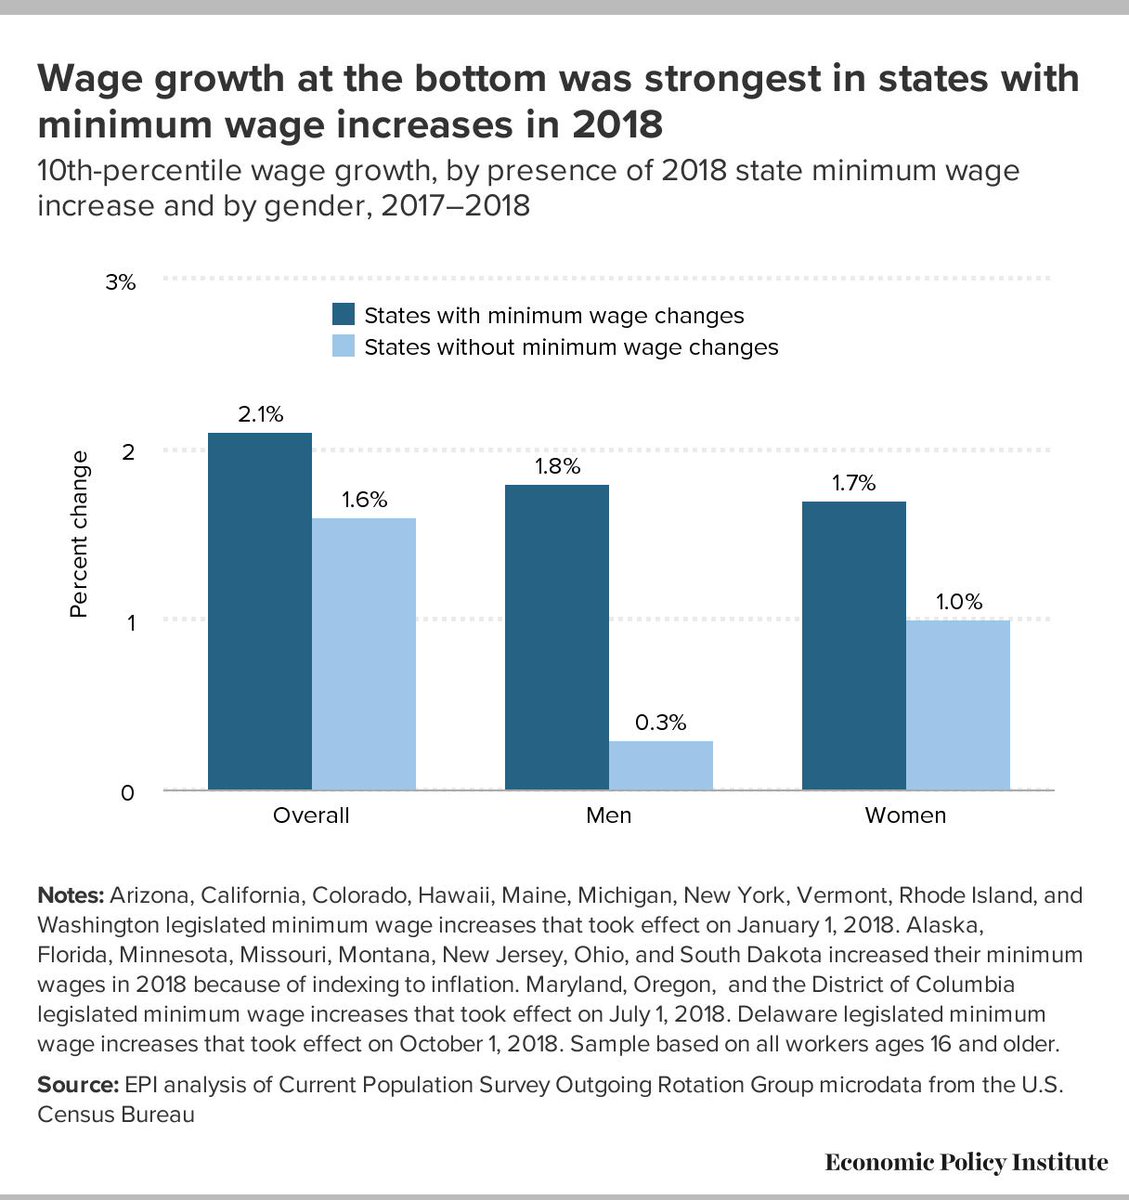
Wage growth at the 10th percentile in states with at least one minimum wage increase from 2013 to 2018 was more than 50% faster than in states without any minimum wage increase (13.0% versus 8.4%). Policy matters!
17/n
17/n

Ok . . . . I let you simmer in the good news and perhaps enjoy the snow day for a little while . . . back to the bad news . . .
18/n
18/n
At every decile, wage growth since 2000 was faster for white and Hispanic workers than for black workers. Over the last 18 years, wage growth for white and Hispanic workers has been 4x faster than that of black workers in the 20-70th percentiles of their wage distributions.
19/n
19/n

Throughout the wage distribution, black-white wage gaps were larger in 2018 than in 2000. The regression-adjusted black-white wage gap (controlling for education, age, race, and region) has become larger over the last year. epi.org/data/#?subject…
20/n
20/n
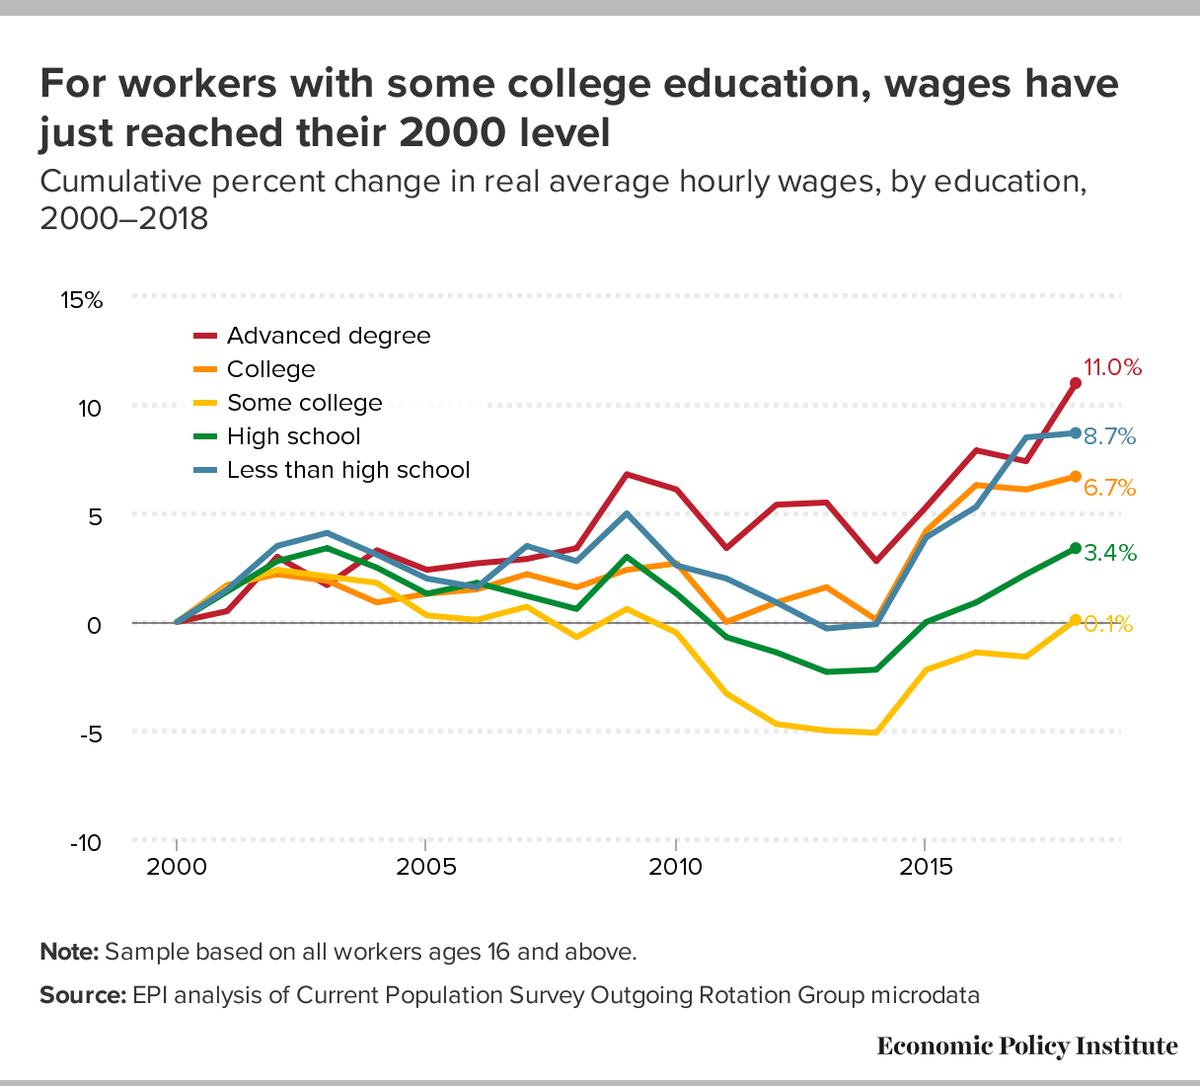
From 2000 to 2018, the strongest wage growth occurred among those with college or advanced degrees. In 2018, workers with "some college" finally reached their 2000 wage levels.
21/n
21/n

Over the last two years, wages of those with a high school diploma rose faster than wages of those with a college degree, narrowing the gap between college and high school wages. As a result, the college wage premium fell from 50.6% to 48.4% between 2016 and 2018.
22/n
22/n
Between 2000 and 2018, the college wage premium rose slightly, from 47.0% to 48.4% over that whole period. The growth in the college wage premium was nowhere near fast enough to explain the total rise in wage inequality over that time.
epi.org/data/#?subject…
23/n
epi.org/data/#?subject…
23/n

Since 2000, wage growth for those with a college or advanced degree was faster for men than for women, while wage growth for those with a high school diploma or some college was faster for women than men.
24/n
24/n


At every education level, women are paid consistently less than their male counterparts, and the average wage for men with a college degree is higher than the average wage for women with an advanced degree.
25/n
25/n

From 2000 to 2018, average wages grew faster among white and Hispanic workers than among black workers for all education groups. Among black workers, only college- and advanced-degree holders had higher wages than in 2000.
26/n
26/n

Black-white wage gaps by education were larger in 2018 than in 2000 for all education groups. At nearly every education level, black and Hispanic workers were paid consistently less than their white counterparts.
27/n
27/n

To put this in context, read @Nina_EBanks: "The black woman’s experience in America provides arguably the most overwhelming evidence of the persistent and ongoing drag from gender and race discrimination on the economic fate of workers and families."
epi.org/blog/black-wom…
28/n
epi.org/blog/black-wom…
28/n
For additional historical context to better understand today's black-white wage gaps, read @ConnieRazza demos.org/publication/so…
29/n
29/n
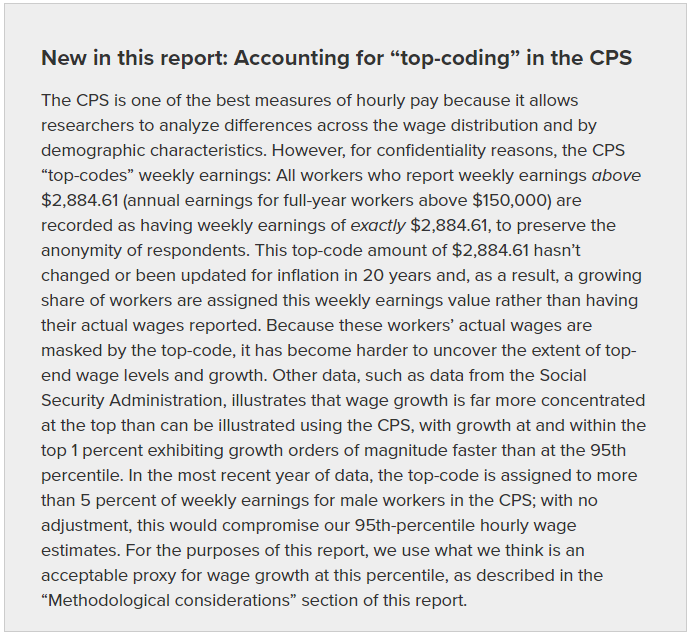
Because men's wages and white wages are typically higher than black, Hispanic, or women's wages, they are more likely to encounter a problem with the BLS top-code on weekly earnings.
30/n
30/n
Top-coding of weekly earnings is catching an increasing number and share of workers as inequality continues to climb, making it increasingly difficult to obtain reliable measures of 95th percentile wages, particularly for male workers and white workers.
31/n
31/n
Find a more extended discussion of top-coding, please see "Methodological considerations" in the report itself: epi.org/publication/st…
32/n
32/n
There's a simple fix: best practice for consistent and accurate data use suggest not only increasing the top-code but also indexing it over time to keep it from hitting an increasing share of the workforce. @BLS_gov 33/n
The fix for the economy and stronger wage growth for all the workers in it requires a multi-faceted approach. Here are some ideas: epi.org/policy/
34/n
34/n
Much gratitude to everyone who made this report possible: @its_Melat @zanemokhiber @JuliaWolfe94 for meticulous programming and research assistance, and @joshbivens_DC @jschmittwdc @hshierholz @ben_zipperer for valuable and relentless contributions on methodological issues.
35/35
35/35