
,
20 tweets,
5 min read
Read on Twitter
Two series. Find which one is a random walk. 

See series on the tweet above. Which one is a random walk?
And these are the auto-correlation estimates for both series (above) as well as of their first differences (below)
Are they helpful?
Are they helpful?

Now lets run some regressions: We regress the first series against their lagged ones by one.
Slope too close to one, consistent with the random walk hypothesis
Slope too close to one, consistent with the random walk hypothesis

Lets see series below.
Slope again too close to one
Slope again too close to one

There must be unit roots in both series (lets assume for the time being). Is there a better test for that than the regression?
Let's run Augmented Dickey Fuller tests
Let's run Augmented Dickey Fuller tests
In both cases, the unit root hypothesis was NOT rejected.
We must be right then. Both are random walks (are they??)
We must be right then. Both are random walks (are they??)

Still not sure though. I wanna look how the periodograms looks like
Periodograms look very similar. And first differences too much like white noise. Don't see and any dominant frequencies 🤔

But remember ADF tests have low power. Lets try the KPSS. Rejection of the null hypothesis could then be viewed as a convincing evidence in favor of a unit root (or not ??).
KPSS rejects null in both series...

But more people so far, seem to believe first series is random walk and second isn't. They must be able to see something those tests couldn't.
Or is it that the human eye "sees" nonexistent patterns than those "objective tests" don't?
Or is it that the human eye "sees" nonexistent patterns than those "objective tests" don't?

Now I give you the chance to change opinion! I've added a 4th option.
So which one is a random walk?
So which one is a random walk?
Lets see whether a plot could help.Scatter-plot of consecutive values of observations for each series and corresponding regression lines.
Till now all seem to suggest both are random walk.All but graph of series (that unless you've now changed your mind).What would you do next?
Till now all seem to suggest both are random walk.All but graph of series (that unless you've now changed your mind).What would you do next?

To sum up:
-ACF show no auto-correlation on the differenced series
-Periodograms(differenced series) look (somehow) like white noise
-Regressions have slopes too close to 1
-Both unit root tests imply compatibility with the random walk hypothesis
Reminder X_t~RW if ΔX_t~N(0,σ)
-ACF show no auto-correlation on the differenced series
-Periodograms(differenced series) look (somehow) like white noise
-Regressions have slopes too close to 1
-Both unit root tests imply compatibility with the random walk hypothesis
Reminder X_t~RW if ΔX_t~N(0,σ)
But I've got more tests for you. Portmanteau tests (Box-Pierce, Ljung–Box) don't reject the hypothesis of stationarity (with the alternative being serially correlated data).
Hence all aligned with prior tests (though we somehow knew results of this test already)
Hence all aligned with prior tests (though we somehow knew results of this test already)

Interestingly, according to this test, had the null of stationarity been true, our chances to observe a Box statistic equal to or more extreme than the value observed would be higher on the second series. 🤔
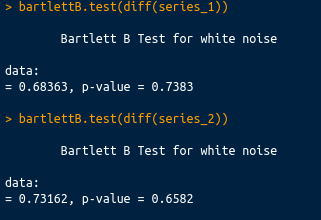
And here are the results of Bartlett's test (see stat.tamu.edu/~jnewton/stat6… ) for white noise
White noise hypothesis not rejected in any of the two
White noise hypothesis not rejected in any of the two
But maybe all those tests are missing something...
Differenced series look normal in both cases. But second seems to have higher variance
Differenced series look normal in both cases. But second seems to have higher variance

Continues:


