
,
16 tweets,
5 min read
Read on Twitter
The 2018 CPS Voting and Registration summary tables are now up. Here is a stunner. The non-Hispanic White share of the electorate (people who voted) declined to 2016 to 2018 from 73.4% to 72.8% census.gov/data/tables/ti… 
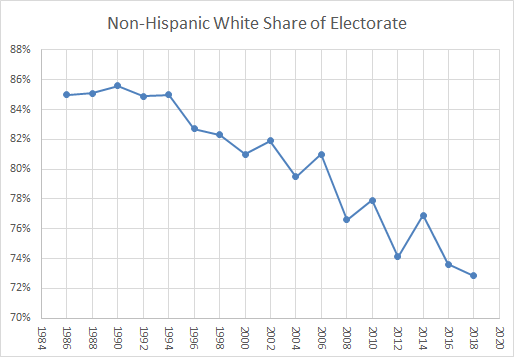
In recent decades, there has been a long-term downward trend in the non-Hispanic White share of the electorate. Usually, the midterm electorate becomes a shade whiter than the last presidential. Not true in 2018 compared to 2016
The 2018 election saw the highest midterm turnout rate since 1914, so I expected the midterm electorate to more demographically like a presidential, but I did not expect to see the non-Hispanic White share of the electorate actually drop from 2016
Youth turnout was up from 2014. As a share of the electorate, 18-24 year olds were 7.1% of the 2018 electorate compared with 5.1% in 2014, a 2 point increase

You might wonder why I'm not posting turnout rates. I'm cautious of CPS turnout rates because they do not account for non-response and vote over-report bias. I need the individual data to make corrections. The electorate demos, however, aren't so sensitive to these polling issues
What does this all mean for 2020? We are likely in for a storm of the century, with turnout levels not seen for a presidential election in the past 100 years. It is likely persons of color and younger people will participate in 2020 at unprecedented levels
The @censusbureau posted the raw individual level 2018 CPS voting and registration data, but there is a broken link for the codebook ☹️
But, that won't stop me! I figured out the which columns go with which variables
But, that won't stop me! I figured out the which columns go with which variables
The following turnout rates are different from those posted by the Census Bureau in that I correct for non-response and vote over-report bias, You can read more why this correction is important here, if that is your cup of tea electproject.org/home/voter-tur…
The turnout rates by race and Hispanic ethnicity are similar to previous midterm elections in that non-Hispanic Whites tend to have the highest turnout rates. The gap between Hispanics and non-Hispanic Whites was 18.3 points, which was slightly less than the 19.7 points in 2014

Interestingly, the turnout rate gap between Hispanics and non-Hispanic Whites was 19.8 points in 2016, so this graphic showing persons of color were a greater share of the electorate in 2018 than 2016 is partially due to higher Hispanic turnout rates in 2018 (relative to Whites)

Turnout rates for citizens age 18-29 nearly doubled from 2014, rising from 16.3% to 32.6%. As a result, the turnout gap between the elderly and young decreased. It was 32.9 percentage points in 2018 compared with 38.6 points in 2014

Despite the surge in youth voting, a large gap of 32.9 percentage points persists, and as the overall population ages, the electorate generally continues to trend older. Perhaps the decline comparing 2018 to 2014 will be evident if 2020 is an exceptionally high turnout election

This sets up the two countervailing trends in the electorate with political import:
The electorate is growing more racially and ethnically diverse at the same time it is growing older
The electorate is growing more racially and ethnically diverse at the same time it is growing older
The percentage of voters reporting they cast an early ballot was 38.0%, down just slightly from 38.8% in 2016. Recently, there is usually a slight drop in early voting activity in the midterm following the last presidential election, but the drop was not as sharp

More states adding early voting options and the unusually high early voting levels in Arizona and Texas likely contributed to the early voting increase in 2018 compared to 2014
Turnout rates by education show that - unlike with race and ethnicity, and age - the gap between the high and low turnout groups increased between 2014 and 2018, the turnout rate gap between high school grads and post-grads was 37.9 points in 2018 compared to 30.9 points in 2014


