,
34 tweets,
9 min read
Read on Twitter
1/ Major Chart Study update from the Dragon's Den. Bookmark this tweet because I will be doing a major update that will take me into Sunday to put together. All based off the original tweet below from June 1 for review.
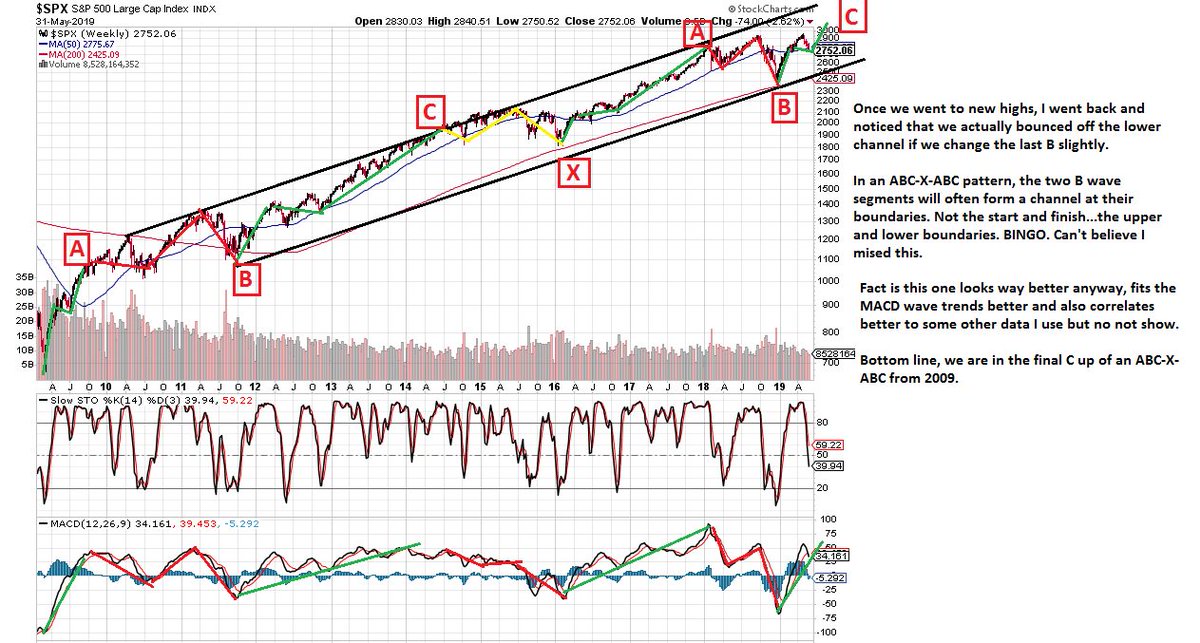
Let's start with the big picture. Chart here posted June 1 is a textbook ABC-X-ABC (fully wave validated) in process off the 2009 low and we are in the final C. This C from Dec, I outlined in green should also be abc and we were about to do the final 'c' up. 
3/ (skipped the 2/ on the last one). Here is the update. Last thrust in progress and clearly divergent.

4/ Also posted on June 1st, here is a closer look at the final C from Dec low, which is an abc internally. As noted it should resemble original A (also abc) off 2009 low.

5/ Here is the update on forecast vs actual

6/ Here is a closer look at the current 5 wave finally rally wedge. I now think we completed w2 and are in 3 up to 3030 or so. The buying energy available from wave validation is rapidly being used and divergences now appearing. Thus, July 8th *could* be the final price peak.

7/ Quite frankly, with so little energy left, I am not concerned about precise number targets. 3030 is ideal but I am now looking to pick up some major short position and scale. We could fall short, we could slightly exceed. In the end, there is something SIGNIFICANT coming.
8/ Since last year the global economy has been slowing, rally since Dec has flown in the face of all this. Since May, the economic collapse began to accelerate, and rally since early June has defied this. Macro be damned. Well, no longer. Markets are about to sync with reality.
9/ Let's continue through the day today by reviewing more of previous forecasts. This one is the $USD. Got the drop. Unclear if this ends the C or there is one more towards 95 that is divergent. I think low is in. Entire pattern is a corrective flat and much higher prices to come

10/ Once that corrective flat completes, a large upswing becomes likely. This is the weekly bigger picture for $USD. Corrective flats are powerful structures and are the basis for nested market structure. NOT 5 wave impulses.

11/ Here is the previous $VIX forecast and result. Expected to hit the rising trendline now near 12.5. Tagged it perfectly. This should be ready to move up now.

12/ $VIX bigger picture and forecast. VIX has been triangulating for 1 1/2 years and just tagged the bottom line again. Are we about to see a mini VIX explosion to 28? If we do, expect pullback and then bust out when market crashes.

13/ VIX pattern is very ominous and matches the index charts that a peak to end the bull market is at hand. This is not something to overlook.
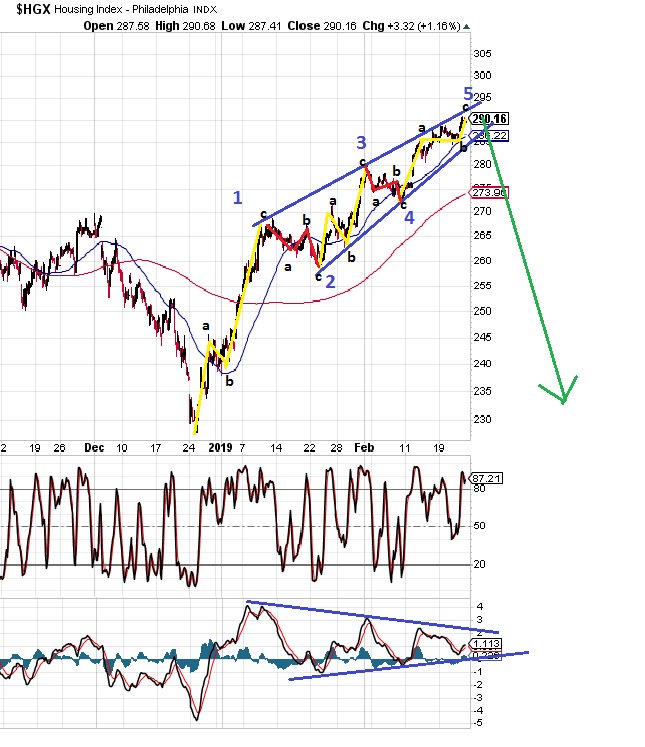
14/ Here is the prior bank index pattern and forecast from June 1st

15/ And current...Again, got the expected rally but this one has been weak. The initial green 3 wave thrust was quite extended. This one not so much but on the 3rd segment and about complete as well.

16/ GS was one bank stock in particular that was expected to benefit and had the same ABC with the B as a corrective flat. C is clearly not as strong as the A and starting to show weakness.

17/ NFLX is another outlined with the same ABC pattern but this C wave is pathetic and even looks like a terminal diagonal itself.

18/ Anyway, just a few examples but clearly our C wave rally developed from early June and is now terminating. That C is the final C in the ABC up from Dec low which in turn as outlined in S&P charts, completes the final C in ABC-X-ABC from 2009 low.
19/ Thus, a major trend change is likely imminent. What is possible? Well for one, it ends the major bull run from 2009. Two we are in for a significant decline over the next 2-3 years.
20/ Without a doubt, the pattern from 2009 is a TEXTBOOK ABC-X-ABC. Anyway else following conventional EW trying to count it as 5 waves is ignoring something because there are very clearly 3 pause points in the trend, the two B's and the X. They even correlate with MACD.
21/ ABC-X-ABC are commonly found in the B waves of an ABC corrective flat. Let's review that here. It's also the 3 peaks and domed house pattern. Again, THIS is THE basis for market nesting. Not 5 wave impulse according to conventional EW
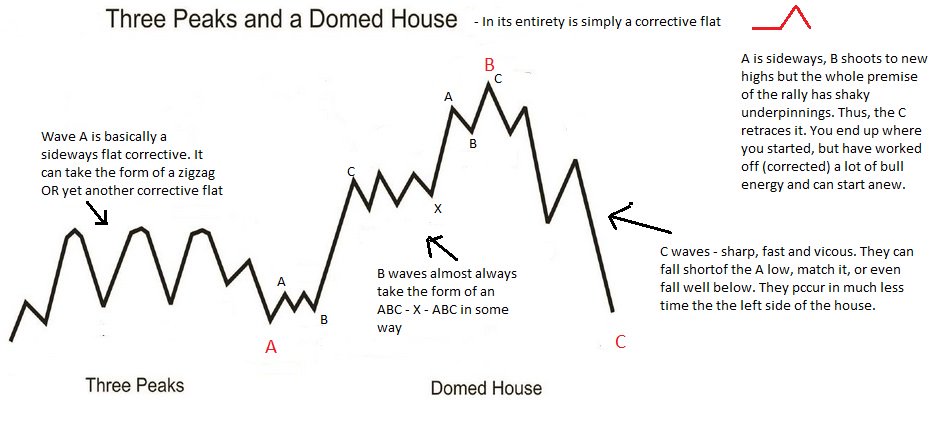
22/ THE BIG PICTURE. At a very minimum, we are about the enter a devastating C wave down in the 3 peaks pattern, aka corrective flat. The evidence is abundant. Indicators highly correlating. Patterns clear. Divergences present. These ALWAYS retrace to start of A at minimum.

23/ But as we saw from the A wave between 2000-2009 (also a corrective flat itself) can often plunge lower. MARK THIS....I have presented very strong evidence that the S&P could very well see the 2009 lows again within a few years and that retrace is about to start.
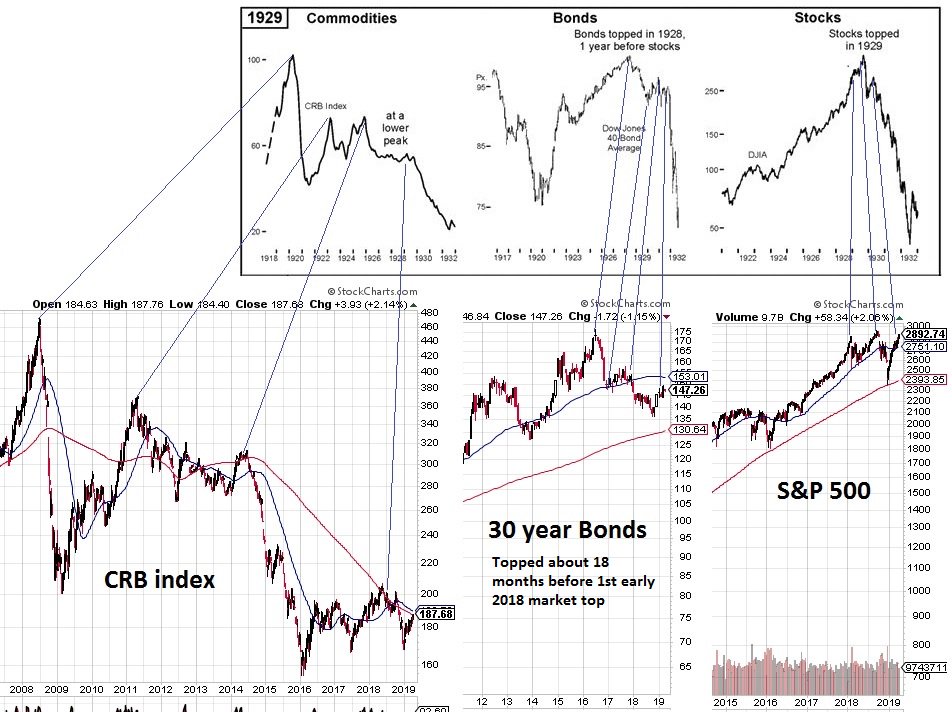
24/ Now let's look even bigger. The 90 year cycle is one of the longest and most powerful. Remember what happened 90 years ago? Yeah, that was 1929. The parallels to that time are amazingly similar. I bet everyone thought it was different that time too.

25/ Go back another 90 years and you come to the Panic of 1837 which led to another Great Depression lasting between 1837 and 1943.
en.wikipedia.org/wiki/Panic_of_…
en.wikipedia.org/wiki/Panic_of_…
26/ Even commodities and bonds are following the same path in the 1920's as they are now in the last decade
27/ Here's where things really get worrisome....how deep will the retrace actually be? Remember that ABC-X-ABC as the B wave? 90 years ago the markets began a major bull born out of the 1932 low. Put this chart next to the rally from 2009. Tell me they don't look the same
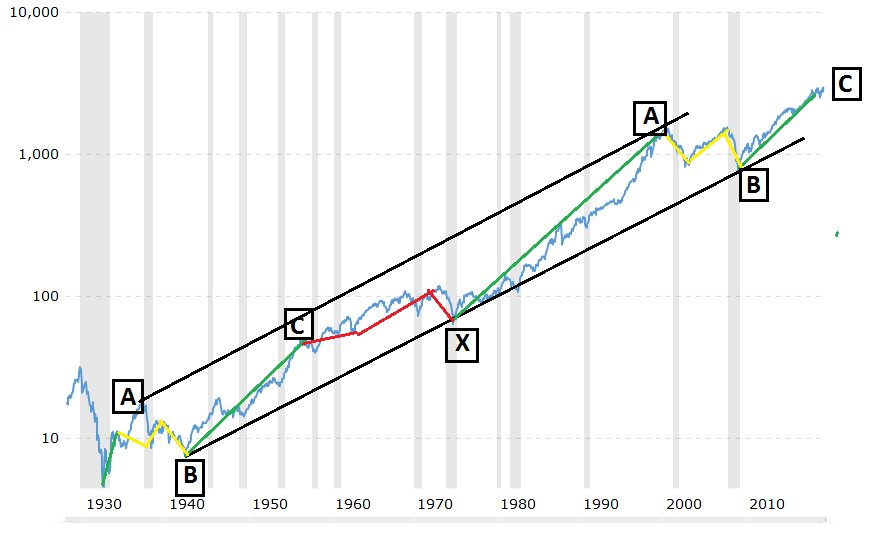
28/ That's an ABC-X-ABC as well and we are in the final C
29/ Look around. Every person, govt and individual is hocked up to their eyeballs in debt. The wealth is concentrated in the hands of the few like never before. The economic imbalance across the board exploding.
30/ How many people do you know that can really afford million dollar+ houses. Housing is un-affordable to the masses. College is for the wealthy. Gen X still paying on their loans and now they have to take out more to help millenials.
31/ I think we are going to embark on a multi-generational rebalancing of wealth and assets that have long gone out of control.
32/ Now let's look at history. IF...IF this is true, the 90 year cycle fits and we are at the cusp of the next one. Note the last one had the market retrace from 1929 to 1932 all the way BACK to the top of the peak in 1837. Are we going back to top of 1929 on this one? GOD forbid

33/ Not saying we get that bad but the scary thing is it all fits. And even THAT chart looks like a corrective flat with the B wave from 1932 to now being a textbook ABC-X-ABC.
34/ Much to think about and watch over the coming decade. At a minimum, a drop towards S&P 600 or so is probably a given in the coming years. Let's hope it ends there.
End of Chart Study.
End of Chart Study.