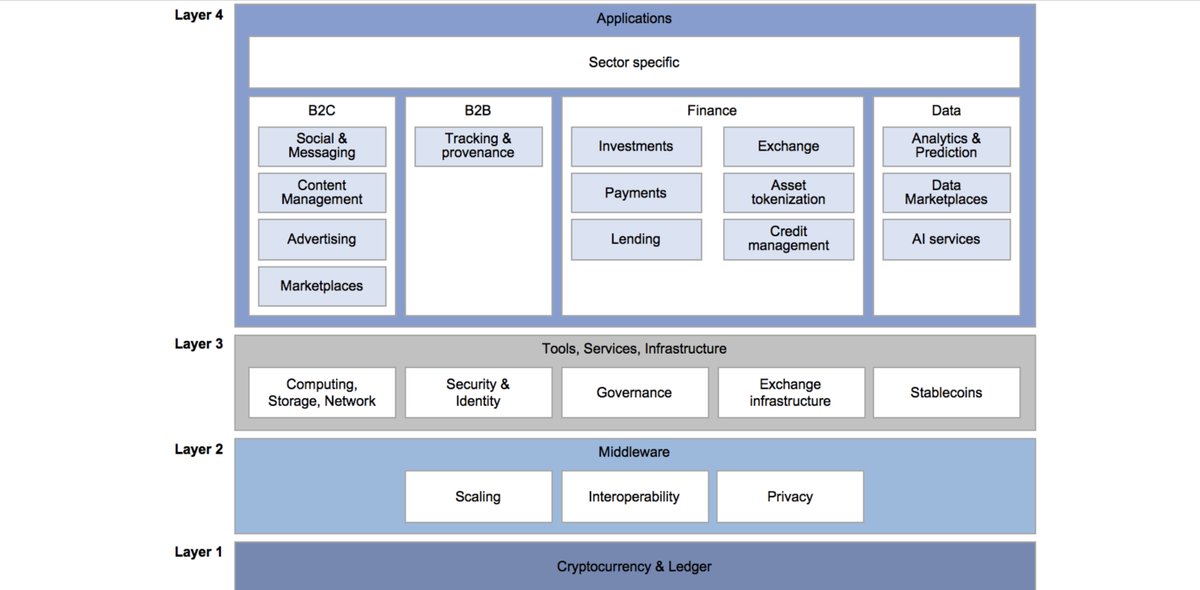
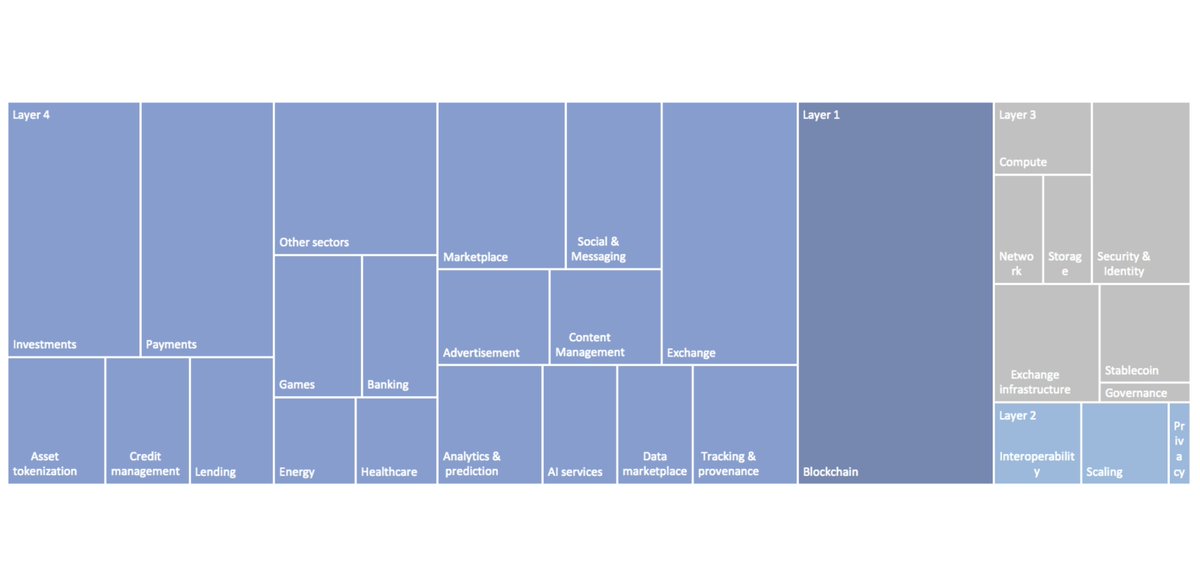
This has been my most ambitious article to-date! Dive into an illustration of Ethereum as a digital finance stack, with metrics and market behaviors found at each level.
I'll summarize below!
Ethereum is a platform, built to support a financial super-structure. User behavior in this super-structure creates market forces that push/pull on the assets that run inside it
Metrics found at each layer of the financial stack will illustrate the economic state of Ethereum
Metric: The ETH Stake Rate
The ETH Stake is the gravitational pull of value into ETH and into the bottom of the stack.
Metrics: The Stability Fee; The Dai Savings Rate
The Dai Savings Rate and the SF are the gravitational pulls of Dai down to the MakerDAO layer
Metrics: Dai Weighted Average Borrow & Supply Rates
The Dai WABR and WASR take the averaged rate that Dai is supplied to, or borrowed from all Dai lending/borrowing platforms.
This layer illustrates the market rates of borrowing or supplying
Metric: ETH Locked in DeFi
The application layer is the "equal and opposite" layer to Layer 0. It is the "push" to the ETH Stake Rate's "pull".
The app layer is a growing set of applications that entice ETH to stop staking, and move up the stack
This is the interface layer. This is the @InstaDApp @zerion_io& @SettleFinance layer, where teams produce applications that bridge protocols, aggregate liquidity, and supply transaction volume
This is where the efficient market hypothesis lives
It also talks about the absolute bull case for Ethereum.
If you enjoy it, please give me claps! Its like money to me.


