
1/ Here’s my #WedNFLXday thoughts, but inspired by Amazon getting their ratings released by #Nielsen. #Netflix @Netflix
2/ In general, the rule of thumb is that something that is popular on one platform or metric, then it is popular on every platform and metric.
I’ll explain ramifications from that, share some tweets that inspired this idea and the limits of the argument now.
I’ll explain ramifications from that, share some tweets that inspired this idea and the limits of the argument now.
3/ Here are the two inspiration tweets for this. First, @stuartsymington on the Nielsen expansion to Amazon (they already do $NFLX, I believe)
5/ To start, I actually think the Nielsen numbers are telling the same story as the Netflix numbers. If you assume that 40-60% of Netflix viewing was US, that gives us roughly 10-15 million US viewers.
6/ If you take “living room TV” as 50-70% of the US audience, that gives us 5-11.5 million US viewers. Nielsen’s 6.5 million is right in that range, at about 25% of Netflix’s US total.
7/ The US/international numbers just come from subscriber splits, and this @pkafka article has 70% of NFLX viewing as living room. So assume 40% US viewing at 70% living room and Nielsen and Netflix match!
8/ This makes sense. Again, if something is popular on one measurement, it’s likely popular on every measurement.
9/ This is a pinch Bayesian in that your "prior" should be popularity crosses platforms/metrics. You’d have to make a pretty convoluted argument to say that if something is “popular” in one place, but it’s somehow not popular in other places.
10/ Take Friends. It was one of the most popular shows on broadcast when it launched, was popular on home entertainment, and was popular in syndication and then on Netflix.
(Which refutes Ted Sarandos’ quote here.)
(Which refutes Ted Sarandos’ quote here.)
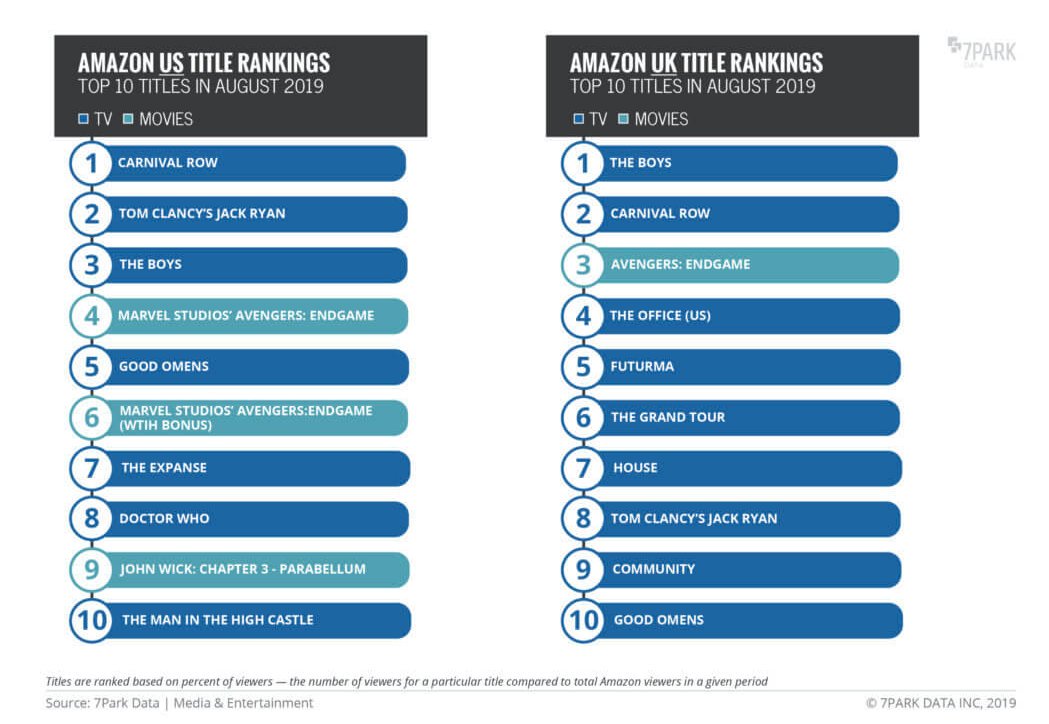
11/ Even now, #AvengersEndgame was the most popular movie in America, and it is currently the most popular movie on Amazon Prime, and it is only available for rent! @7ParkData 
@7ParkData 12/ Crucially for all shows, this applies to all the different ways you can measure popularity too. If something has a lot of customers watching, they tend to consume the most by hours or streams too. (Definitions in this article I wrote.)
entertainmentstrategyguy.com/2018/12/19/don…
entertainmentstrategyguy.com/2018/12/19/don…
13/ This applies to qualitative metrics too. So popular shows tend to have the most ratings on sites with customer reviews (Amazon, IMDB, Rotten Tomatoes) and they tend to have higher scores.
Again, popularity is popularity.
Again, popularity is popularity.
14/ Most importantly, this ties to the all elusive quantification of “value”. How valuable is a show truly to a streamer? As I’ve written, this is best tied to retained/acquired subscribers.
entertainmentstrategyguy.com/2019/05/22/got…
entertainmentstrategyguy.com/2019/05/22/got…
15/ But, if you follow my logic, if raw numbers like hours viewed or customers watching are all correlated with success, and so is retained and acquired subcribers, then even if you *only* have viewership numbers, you can estimate at the value.
16/ On to ramifications. This means that if Nielsen has an accurate representative group of Americans in their sample size, then shows that are popular on their ratings are probably popular by whatever method Netflix uses to evaluate them.
17/ Or take Parrot Analytics. They have their own demand metrics, as this thread discussed, but for the most part I’d bet you they are 75-90% correlated with Nielsen ratings. Again, popularity is popularity.
(And I really like @ParrotAnalytics work. More data is better)
(And I really like @ParrotAnalytics work. More data is better)
18/ As for "device" (mobile vs desktop vs living room). Nielsen may only do set top TV, and Jumpshot may only do desktop viewing, but for the most part, again, if something is popular on one method of watching, it’s popular on all the methods.
19/ Certain shows may over or under index one way or the other, but those will be outliers that in the extremes come out in the wash. (Again, Game of Thrones was the most popular show for HBO on every platform.)
And I never saw it.
And I never saw it.
20/ On to limitations of this theory. The limitations start with “correlation”. Which does not mean 1 to 1 causation. Which is why say Nielsen ratings may be 80% accurate, but ParrotAnalytics are say 85% accurate whereas the streaming companies have 100% data.
21/ But again, for the most part 80% correlation will serve execs trying to determine if they have a hit show compared to their competitors.
22/ Also, some metrics will have limitations the way they are measured, like half an hour shows will (by definition) have has as much to watch as one hour shows, but they’ll have higher completion rates.
23/ Also, the more representative a sample in the measurement, the more correlated it will be. For the most part, platform usage doesn't skew demographically one way or the other. (Again, most part.)
24/ There is definitely more demographic skew in some qualitative data (like IMDb ratings) so it will be less correlated with viewership. (For the most part, look at IMDb's top shows and that list jives.)
25/ Social media may have the most skews demographically. Again, for the most part these will be outliers, but certain social channels over index for different demographic groups which is why I tend to value them the least. (That and bots.)
26/ Finally, popular shows in one country tend to be popular globally, but this is absolutely less correlated than within a country.
I tend to solve this by getting country by country data, if I can.
I tend to solve this by getting country by country data, if I can.
27/ For the most part, though, if @nielsen or @ParrotAnalytics or @7ParkData or @jumpshotinc has viewership data, it’s totally accurate. You can definitely buy into it.
@nielsen @ParrotAnalytics @7ParkData @jumpshotinc 28/ Final note: much of this is personal experience crunching the data and pulling lots of correlations, but my journalistic data gathering only continues to back it up.
29/ And if you are a working journalist who has questions, DMs are open.


