ROKU 2/5
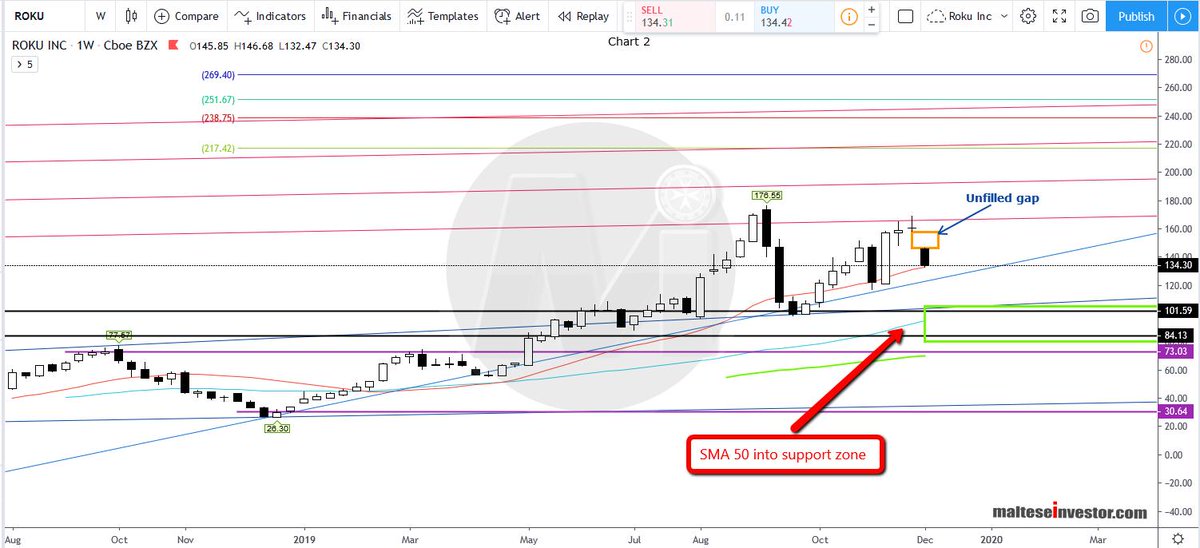
Weekly Chart: The #SMA 50 is right into the support zone at 94.91, the SMA 100 at 70.13. The SMA 20 at 132.65 has temporarily stilled the down move. An unfilled gap exists.
ROKU 4/5
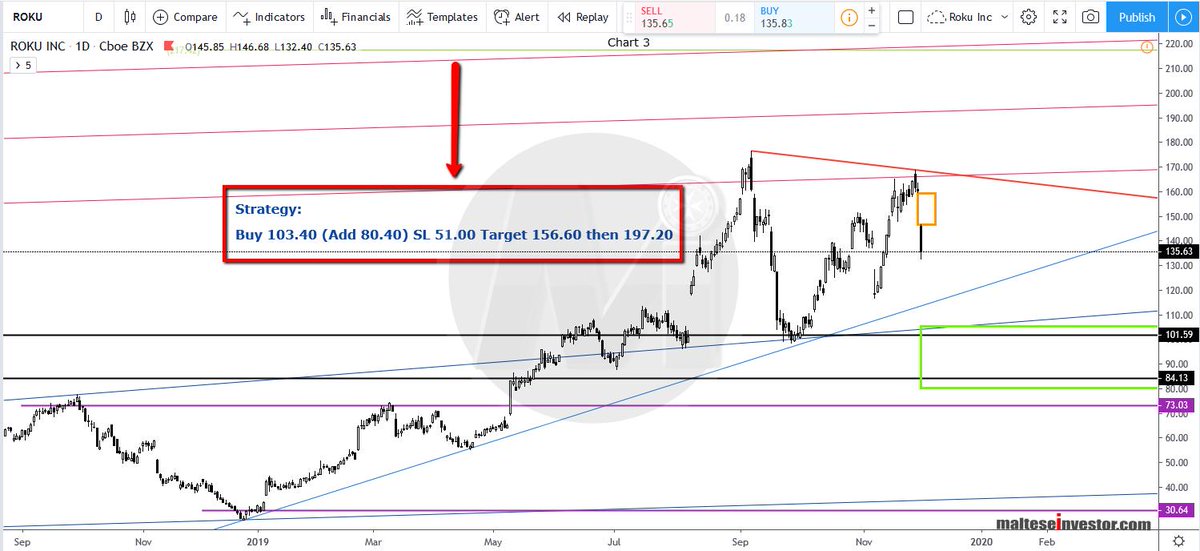
Daily Chart: The short term sell signal has already triggered - pointless listing it here. We wait for the short term buy signal to appear.
The long term #strategy is printed on the image.
$ROKU 5/5
