As 2019 comes to a close, I want to thank all of the lovely people in the #rstats world who have made my year a professional success. For each person in this thread, I'm going to tweet one thing they've done that I particularly appreciate.
I struggled with learning R for a long time — until I made the switch to the tidyverse. As the driving force behind the tidyverse, I'm incredibly grateful for the all of the work that @hadleywickham has done.
tidyverse.org
tidyverse.org
I like to think about workflow. No one has been more influential in my thinking in this area than @JennyBryan. The What They Forgot to Teach You About R materials she has put together (along with @jimhester_) have helped me tremendously.
rstats.wtf
rstats.wtf
Another person who focuses a lot on workflow is @EmilyRiederer. I'm still working on truly grasping her article on RMarkdown Driven Development.
emilyriederer.netlify.com/post/rmarkdown…
emilyriederer.netlify.com/post/rmarkdown…
The resources that @apreshill put out are incredible. I've learned about {bookdown}, {xaringan} and more from her website.
alison.rbind.io
alison.rbind.io
Alison is part of the RStudio education team, who are putting out amazing material. Their primers are a great (and free!) resource to learn about R.
rstudio.cloud/learn/primers
rstudio.cloud/learn/primers
The work that @sharlagelfand did to automate report creation is truly inspiring. I share it with my clients who are interested in learning about why they should switch to R.
Explaining dplyr joins to people is hard. @grrrck has made it a million times easier for me with his tidyexplain animated GIFs.
garrickadenbuie.com/project/tidyex…
garrickadenbuie.com/project/tidyex…
@thomasp85 has developed a bunch of packages for data visualization. I'm particularly in awe of how easy he has made it to generate animations with his {gganimate} package.
gganimate.com
gganimate.com
Another free book on data viz is by Fundamentals of Data Visualization @ClausWilke. Available here: serialmentor.com/dataviz/
I'm also excited about his {ggtext} package to do things like add multi-color titles to plots.
I'm also excited about his {ggtext} package to do things like add multi-color titles to plots.
I'm grateful to @kara_woo and @kwbroman for their article Data Organization in Spreadsheets. It's a great resource that I share with people less immersed in data than those in #rstats world.
tandfonline.com/doi/full/10.10…
tandfonline.com/doi/full/10.10…
The {unheadr} package that @LuisDVerde has developed is super helpful in getting funkily-formatted data into R.
github.com/luisDVA/unhead…
github.com/luisDVA/unhead…
The work that @kierisi did to start the @R4DScommunity is so valuable. She gave a great talk about it, and "how future iterations of similar groups can more proactively center on bringing about diversity, equity, and inclusion to data science spaces."
bit.ly/2Qf4eVG
bit.ly/2Qf4eVG
The #rstats resources that @dataandme shares on her Twitter feed are absolute gold. She was the inspiration for how I've run the @rfortherest account.
For a long time I struggled with how to reorder bar charts within facets. Then @juliasilge went ahead and solved all of my problems. juliasilge.com/blog/reorder-w…
I'm grateful to have @jonthegeek providing guidance to others over @R4DScommunity. I always send people learning R there. I really enjoyed speaking to him earlier this year.
Speaking of people I had a chance to interview this year, I appreciate @RikaGorn's willingness to share her experience with R, especially her perceptive words that "you need to also be a data engineer or computer programmer" to use R effectively.
rfortherestofus.com/2019/04/my-r-j…
rfortherestofus.com/2019/04/my-r-j…
The work that @thomas_mock has done with #TidyTuesday is amazing. I love seeing the visualizations every week that people produce.
github.com/rfordatascienc…
github.com/rfordatascienc…
Over the course of 2019, @CedScherer produced some of my favorite #TidyTuesday visualizations. He also put together a great post titled. A ggplot2 Tutorial for Beautiful Plotting in R.
cedricscherer.netlify.com/2019/08/05/a-g…
cedricscherer.netlify.com/2019/08/05/a-g…
I enjoyed @ludmila_janda's talk The ggplot glow-up: Making Lovely Data Visualizations in R. Great for folks who want to take their data viz to the next level.
@ludmila_janda Getting custom fonts to render correctly when saving PDFs is surprisingly challenging. This post by @andrewheiss has helped me several times.
bit.ly/2QA9YIL
bit.ly/2QA9YIL
It's hard to pick one thing that I value from @hrbrmstr. He's done so much. But since I almost always use his lovely {hrbrthemes} package, I'll go with that.
github.com/hrbrmstr/hrbrt…
github.com/hrbrmstr/hrbrt…
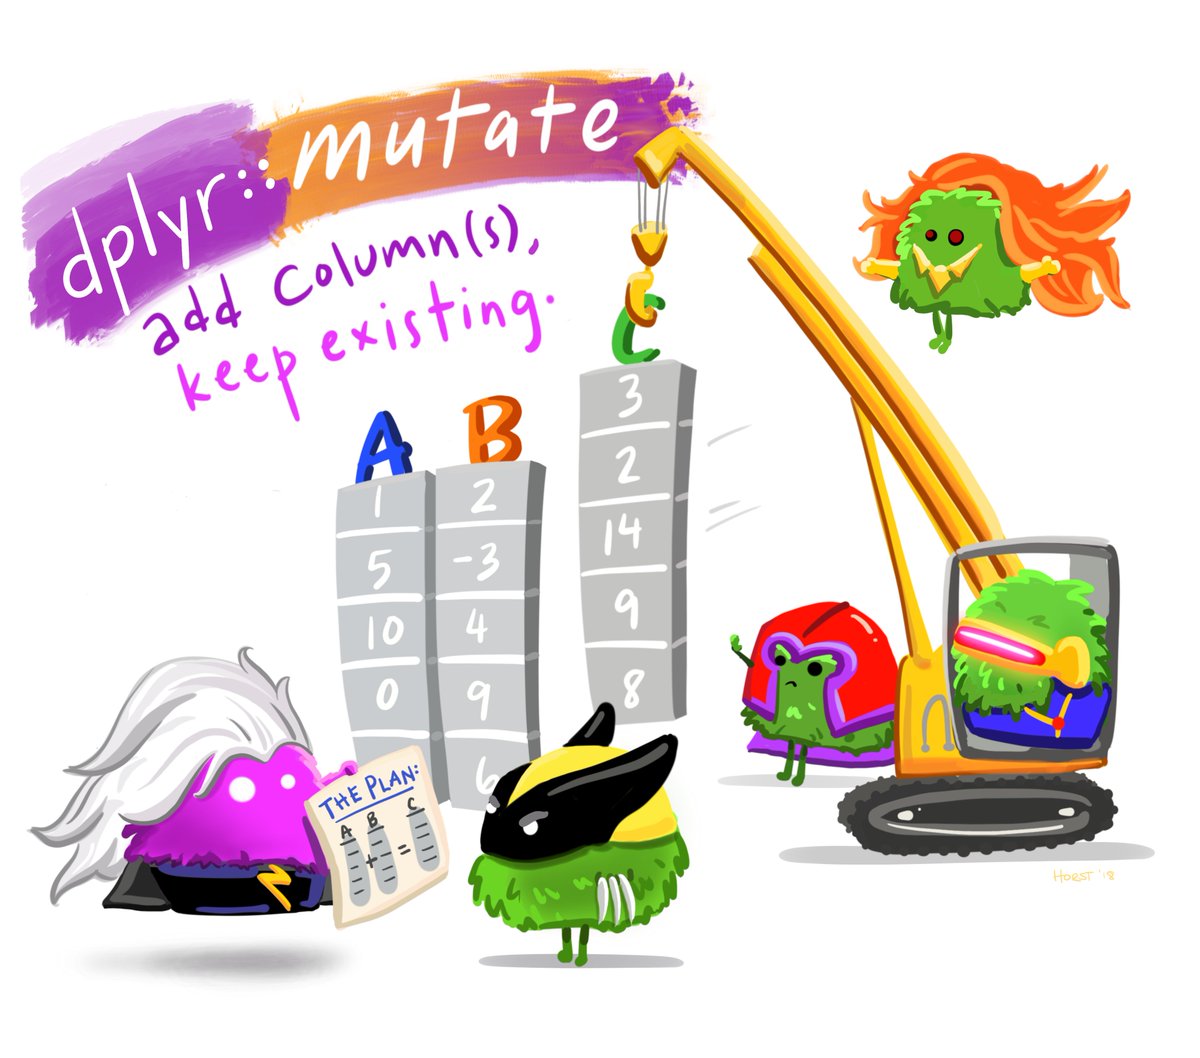
@hrbrmstr @sctyner So much programming education is just words, with not nearly enough visuals. In 2020, one of my goals is to incorporate the incredible artwork of @allison_horst into my teaching.
github.com/allisonhorst/s…
github.com/allisonhorst/s…
@hrbrmstr @sctyner One of the things I most appreciate about the R community is that many people within it value the diversity of its user base. The work that @Shel_Kariuki is doing with @AfricaRUsers is just one example of this.
There's also, of course, @WeAreRLadies, which has played an outsized role in making the R community diverse (see bit.ly/39rCzbP). Their account is a must follow!
@WeAreRLadies In 2019, I came to love the {mapdeck} package. Thanks to @symbolixAU for putting it together.
Most people know @kearneymw for his {rtweet} package, but if you haven't read his Three things to know beyond base R, it's worth a read!
mikewk.com/post/2019-04-2…
mikewk.com/post/2019-04-2…
I had a conversation this year with @datalorax_ that changed my view of what it means to work with data.
@datalorax_ Sometimes I see things in the #rstats hashtag and I'm just like: how did they do that? The aRt that @W_R_Chase makes is consistently one of these.
williamrchase.com/post/disintegr…
williamrchase.com/post/disintegr…
@datalorax_ @W_R_Chase Learning Statistics with R by @djnavarro is an amazing resource about, um, learning statistics with R. It's also incredibly well written, even funny at times, which is rare for a book in this genre!
@datalorax_ @W_R_Chase @djnavarro After I do intro sessions with new R users, one of my pieces of advice is to watch others code. The first place I always send them is @drob's YouTube page. His #TidyTuesday screencasts are super informative.
youtube.com/user/safe4demo…
youtube.com/user/safe4demo…
@datalorax_ @W_R_Chase @djnavarro @drob I've longe used the outline feature in RStudio, but @natedayta's tip to use asterisks for sub-sections is not something I had ever considered. Brilliant!
When I started using #rstats I had no idea you could use it for geospatial work. In the last year, that's become a huge portion of my data viz work. I learned a ton by reading @robinlovelace, @jakub_nowosad, and Jannes Muenchow's Geocomputation with R.
geocompr.robinlovelace.net
geocompr.robinlovelace.net
I also learned a lot about geospatial work from following @CivicAngela's work. Here's a great set of materials she shared this fall.
I really like the {biscale} package from @chrisprener. I super excitedly used it for the first time earlier this year.
@chrisprener @katiejolly6 writes some great posts on building maps in R. For example, this one recreating a map from the New York Times.
katiejolly.io/blog/2019-08-2…
katiejolly.io/blog/2019-08-2…
The flipbooks that @EvaMaeRey makes demonstrating things like ggplot and data cleaning are super helpful.
While we're on data cleaning, @Cghlewis gave a talk recently to R-Ladies St Louis. It's got slides and sample code!
github.com/Cghlewis/R-Lad…
github.com/Cghlewis/R-Lad…
I love finding new palettes to work with. The {paleteer} package from @Emil_Hvitfeldt brings together a ton of them in one place.
My favorite package for taking a quick look at my data after importing it is {skimr}. Developers @michaelquinn32 and @ElinWaring put in a ton of work this year to update it to v2.
@michaelquinn32 @ElinWaring I'll re-up my thread on packages to make tables. Thanks to @riannone, @haozhu233, @renkun_ken, and @DavidGohel for some amazing packages!
@michaelquinn32 @ElinWaring @riannone @haozhu233 @renkun_ken @DavidGohel I loved this quote from the interview I did with @kamal_hothi.
"Learning is a social act, it is easy to draw value from a community which takes such joy in sharing."
rfortherestofus.com/2019/11/my-r-j…
"Learning is a social act, it is easy to draw value from a community which takes such joy in sharing."
rfortherestofus.com/2019/11/my-r-j…
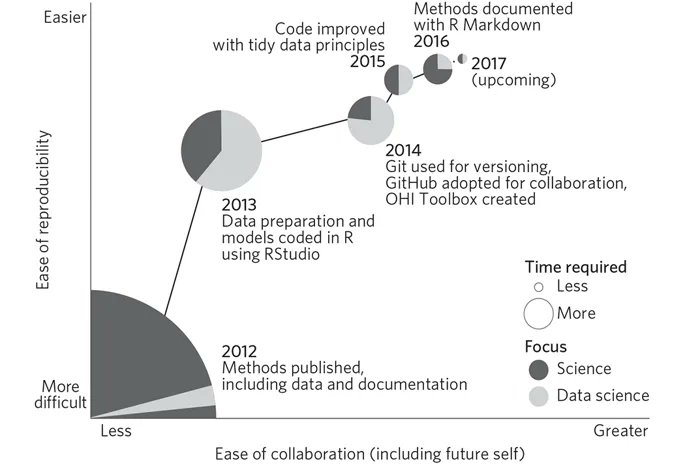
This article by @juliesquid and friends titled "Our path to better science in less time using open data science tools" is really inspiring. My favorite part is this graph that shows how much more efficient you get over time when you work with #rstats.
nature.com/articles/s4155…
nature.com/articles/s4155…
@minebocek played a big part in putting together Data Science in a Box. It's got material on "data acquisition and wrangling, exploratory data analysis, data visualization, inference, modeling, and effective communication of results." Very useful!
datasciencebox.org
datasciencebox.org
I read @R_cookbook by @CMastication and Paul Teetor over the holidays. Organized around the idea of "recipes" to do specific things, it's also going to be a great reference for me as I have problems I need to solve in the future.
rc2e.com
rc2e.com
@R_cookbook @CMastication Parameterized reporting is one thing that blows people's minds when they learn about it. I appreciate the article that @awunderground has on the Data@Urban blog about how it works. I share it all the time with people!
medium.com/@urban_institu…
medium.com/@urban_institu…
Speaking of @urbaninstitute, I enjoyed following @jschwabish's journey as he learned R this year. He discussed it, alongside his teacher @awunderground, on an episode of the @policyviz podcast.
policyviz.com/podcast/episod…
policyviz.com/podcast/episod…
I don't have much use for shiny spinning objects in my work, but if I did, I'd be PSYCHED to use the {rayshader} package (rayshader.com) that @tylermorganwall has created.
I had the chance to meet @gdequeiroz in person earlier this year. It was lovely to meet someone whose work starting R-Ladies has been so impactful.
qz.com/work/1661486/r…
qz.com/work/1661486/r…
@gdequeiroz The {ggrepel} package to ensure that text doesn't overlap on your plots is so simple and so powerful. Thanks to @slowkow for making it!
@gdequeiroz @slowkow @tladeras and @datapointier describe their R Bootcamp "is a gentle and gradual introduction to manipulating and visualizing data in R using the `tidyverse` suite of packages." (This may be the first time bootcamp and gentle are used together.)
r-bootcamp.netlify.com
r-bootcamp.netlify.com
I use a bunch of the packages developed by @rOpenSci. Kudos to @sckottie, @_inundata, @StefanieButland, @opencpu, @ma_salmon, and everyone else involved in developing and maintaining them.
ropensci.org/packages/
ropensci.org/packages/
When I was just starting to learn R I took @martinjhnhadley's course on Shiny. It was a great introduction (although it mostly taught me I wasn't ready for Shiny). They released a new version of this course this summer.
@sharon000 regularly publishes articles and videos with #rstats tutorials. Whenever I need to use the {gmailr} package I refer to her tutorial.
infoworld.com/article/339870…
infoworld.com/article/339870…
File this under work that is very different from my own but which I still find inspiring: @_johnmackintosh's blog post on demonstrating the flow of patients in hospitals is something that got me excited when I was thinking about learning R.
johnmackintosh.com/2017-12-21-flo…
johnmackintosh.com/2017-12-21-flo…
Factors are super confusing. When I'm teaching them, I'm glad to know that I can point people to this video and article by @AmeliaMN.
📽️ resources.rstudio.com/rstudio-conf-2…
📜peerj.com/preprints/3163…
📽️ resources.rstudio.com/rstudio-conf-2…
📜peerj.com/preprints/3163…
@AmeliaMN The @ModernDive book is a great intro to inerential stats using R. It's available in print (amzn.com/0367409828/) or onilne. Thanks to @old_man_chester and @rudeboybert for putting it together!
moderndive.com
moderndive.com
The {visdat} package is another option to take a look at your data after you import it. With functions for examining data types, missing data, and more, it's super helpful. I appreciate @nj_tierney's work on it!
visdat.njtierney.com/index.html
visdat.njtierney.com/index.html
Once you know the basics of {dplyr} you can do a lot. But there's so much more you can do, as @SuzanBaert shows in this set of tutorials.
Part 1: suzan.rbind.io/2018/01/dplyr-…
Part 2: suzan.rbind.io/2018/02/dplyr-…
Part 3: suzan.rbind.io/2018/02/dplyr-…
Part 4: suzan.rbind.io/2018/04/dplyr-…
Part 1: suzan.rbind.io/2018/01/dplyr-…
Part 2: suzan.rbind.io/2018/02/dplyr-…
Part 3: suzan.rbind.io/2018/02/dplyr-…
Part 4: suzan.rbind.io/2018/04/dplyr-…
In 2019, I learned to use the {purrr} package, which totally transformed my work. I used this blog post from @robinson_es along the way.
hookedondata.org/going-off-the-…
hookedondata.org/going-off-the-…
There are a few approaches that I hope to incorporate into my work in 2020. One is the {golem} package, which @_ColinFay and the other developers describe as a "Framework for Building Robust Shiny Apps."
thinkr-open.github.io/golem/
thinkr-open.github.io/golem/